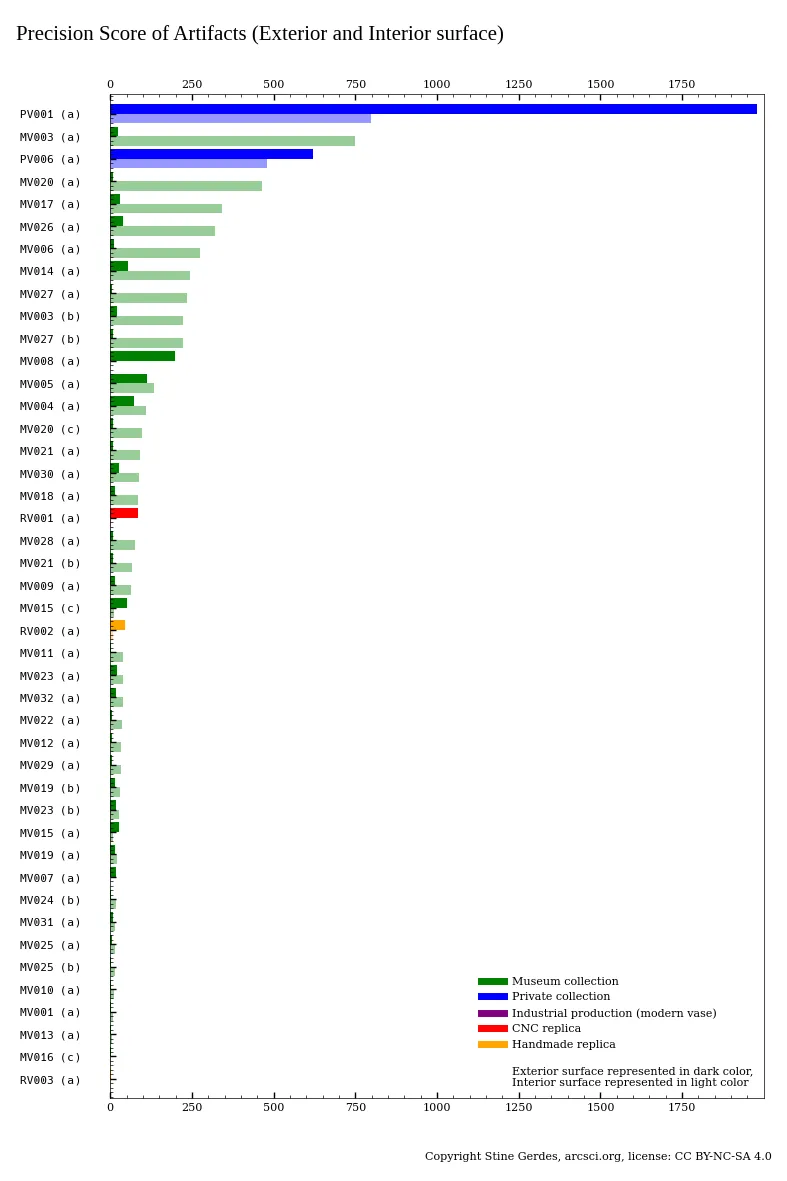
 Figure 1: Precision scores per artifact
High-resolution 3D scans of 32 stone vessels from the Petrie Museum have now been analyzed, and extensive precision reports have been published for each artifact. This release represents the second phase of reporting, building upon the initial publication in March 2025, which presented precision analyses for the first 19 scanned objects from the same collection. Since then, the methodology has been refined and the reports updated to include several additional geometric metrics, enhancing the depth and comparability of the dataset.
Each report provides a detailed assessment of geometric precision using quantitative measures adapted from Geometric Dimensioning and Tolerancing (GD&T), standards typically applied in industrial manufacturing. These include:
By applying these metrological standards to ancient artifacts, we establish a rigorous, objective framework for evaluating the skill and technological capabilities of Predynastic and Early Dynastic Egyptian craftsmen, revealing the extent to which assumed manual techniques could achieve near-industrial levels of geometric control.
Surface variability (deviations from an idealized smooth surface) has been quantified for each object by comparing 3D scan data to a derived best-fit surface model. This innovative approach eliminates the traditional reliance on CAD models, which are currently the standard for analyzing manufactured parts. The best-fit model is generated by fitting a series of mathematical functions to the 2D profile of the scan data, creating a smooth, continuous surface that mathematically represents the artifact’s actual curvature. By comparing the scanned surface points ($y_i$) to this derived best-fit surface ($\hat{y}$), we can quantify deviations across the entire object.
By bypassing the need for a CAD model, this method allows deviations and surface irregularities to be analyzed and visualized in a rigorous, standardized way. A color-coded heatmap is overlaid on the scan data to highlight variations, transforming raw numerical data into an intuitive visual representation. This process, developed to address limitations in conventional metrology, enables precise, artifact-specific analysis without prior design information.
To enable cross-artifact comparison, we introduce a Precision Score, a scalar metric that synthesizes overall geometric fidelity. Since achieving high precision becomes exponentially more difficult, a linear average of deviations would underrepresent this effort. Instead, we use the inverse of the Mean Squared Deviation (MSD):
This formulation ensures that small improvements in precision at high levels (i.e., very low deviations) result in disproportionately higher scores, accurately reflecting the increasing difficulty of achieving near-perfect symmetry and smoothness.
As a benchmark, a Zeiss 1.00000 inch reference sphere, representing the upper limit of spherical precision in modern metrology, was scanned under identical conditions (scanned by Max Fomitchev-Zamilov using a Keyence VL-500 scanner, rated accuracy ±10 µm) and assigned a Precision Score of 43,943. This value serves as a reference point for evaluating how closely ancient craftsmanship approaches industrial-grade accuracy.
The Precision Scores for all 32 artifacts are presented in Figure 1. While no vessel matches the perfection of the Zeiss sphere, several achieve remarkably high scores, suggesting an extraordinary level of control over shape and surface during their manufacture, millennia before the advent of electricity or metal lathes.
Figure 1: Precision scores per artifact
Most scanned artifacts date to the Naqada period (c. 4000–3100 BCE), before the pharaohs and the unification of Egypt, a time of transition from hunter-gatherer societies to settled communities. Naqada artisans drilled with weighted tubular drills of copper and quartz sand, so any near-perfect interior is noteworthy. Figure 2 summarizes the total precision score (exterior and interior combined) by artifact and period.
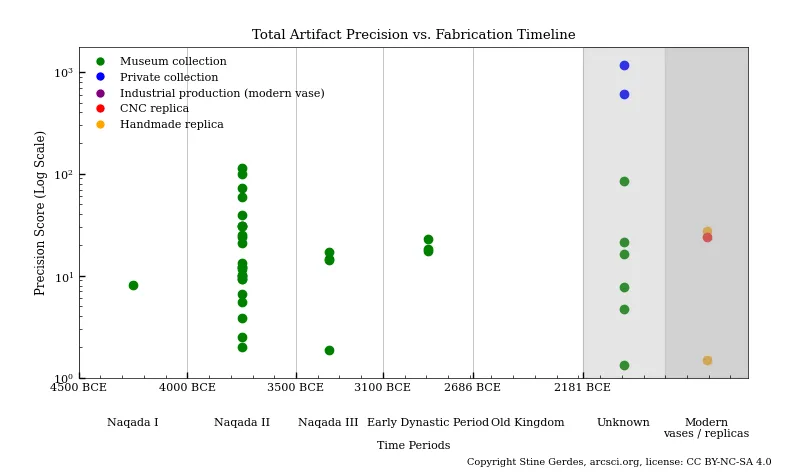 Figure 2: Precision score vs. time period
This work bridges archaeology and engineering: for archaeologists, systematic deviations are clues to production techniques and cultural practices; for engineers, they represent a fascinating case study in human skill operating at the edge of pre-industrial possibility. The following sections present key findings from this analysis, revealing patterns in precision, symmetry, and surface quality across the collection.
The reports can be downloaded in the Catalogue section.
Max Fomitchev-Zamilov (May 2025): Max Fomitchev-Zamilov traveled from the US to the UK with his Keyence VL-500 3D laser scanner to obtain high-quality 3D scans of 19 vessels from the Petrie Museum (University College London). Notably, Max’s scanner captured ~30% of interior surfaces, facilitating detailed exterior–interior comparisons. I am deeply grateful for his massive endeavor in obtaining this data, his work and his honest curiosity. In addition to obtaining 3D scans of the artifacts, he performed XRF (X-ray fluorescence) spectroscopy to determine elemental composition and gamma-ray spectroscopy to analyze the artifacts’ radioisotope signatures. Visit his website to explore his research of the datasets.
Max has uploaded all obtained data for everyone to download and analyze, enabling truly open research:
Max Fomitchev-Zamilov, 3D Scans of the Naqada Period Stone Vessels from the Petrie Museum of Egyptian and Sudanese Archeology, 2025.
Max Fomitchev-Zamilov, XRF Spectra of the Naqada Period Stone Vessels from the Petrie Museum of Egyptian and Sudanese Archeology, 2025.
Max Fomitchev-Zamilov, Gamma Spectra of the Naqada Period Stone Vessels from the Petrie Museum of Egyptian and Sudanese Archeology, 2025.
Károly Póka & Adam Young (September 2024): Károly Póka and Adam Young visited the Petrie Museum with their FreescanCombo+ scanner and obtained scans of 19 vessel artifacts, 4 drill cores, 1 pottery vessel and 1 calcite vessel.
While the raw scan data was shared with ArcSci for analysis, as of yet, none of their scan data, analysis or research has been made available to the public.
This analysis of high-resolution 3D scans of 32 stone vessels from the Petrie Museum reveals three major patterns in manufacturing technique and geometric execution. Each finding provides new insight into the methods, constraints, and intentions of Predynastic and Early Dynastic stoneworkers. The following summarizes the core results, with detailed discussion to follow in subsequent sections.
Repositioning events during fabrication: Subtle shifts in rotational axis are detectable across most artifacts, indicating discrete mounting phases during production. The most consistent repositioning occurs between interior and exterior working stages. Notably, a third and fourth repositioning event is identified within the interior and exterior shaping process itself. Nearly all Petrie Museum vessels exhibit evidence of four distinct mounting episodes.
Superior interior precision: Contrary to expectations, the interior surfaces of many vessels exhibit higher geometric precision than their exteriors, despite greater physical constraints. While Petrie Museum artifacts as a whole show lower overall precision scores compared to both privately held ancient vessels and modern CNC-lathed reference vases, certain interior zones—particularly the rim and upper cavity, achieve exceptional circularity and surface regularity, rivaling industrially produced components.
Intentional elliptical exterior forms: A significant subset of basalt vessels displays coherent elliptical shaping on their external surfaces, while maintaining perfectly circular interiors. Because the Precision Score metric assumes circular symmetry, these elliptical forms result in artificially inflated deviation measurements and suppressed scores, not due to poor workmanship, but due to form-model mismatch.
Each of these findings will be explored in detail in the sections that follow. Comprehensive comparative studies—including side-by-side analyses with modern CNC-lathed vases and artifacts from private collections, will be published in forthcoming articles.
A key observation from this analysis is the presence of repositioning events (discrete shifts in the artifact’s orientation during fabrication). These shifts are not visible to the naked eye but are detectable through precise computational methods. To identify them, circular regression was applied to cross-sectional slices from each 3D scan. This technique calculates the best-fitting center point of each circular slice, effectively mapping the internal and external central axes of the vessel.
These center points were then analyzed using 3D line fitting to assess coaxiality (a measure of how straight and consistent the central axis is along the full height of the artifact). In a perfectly uniform, single-setup turning process (as seen in modern lathes), all center points would align along a single, continuous axis. However, the results reveal a different story: instead of one coherent axis, multiple sub-axes emerge, each representing a distinct phase of working.
These repositioning events likely arose from practical limitations: the difficulty of accessing certain areas of the vessel with rigid tools, the need to re-clamp or re-anchor the stone blank, or ergonomic constraints during prolonged grinding and polishing. What is remarkable is not just that repositioning occurred, but that each working phase exhibits high internal coaxial stability. This indicates that once positioned, the artisan worked with exceptional control and precision, minimizing drift within each stage.
These findings offer insights into ancient craftsmanship, demonstrate both technical skill and adaptability.
The 3D visualization (Figures 3 and 4) plots the center points derived from circular regression across the artifact’s height, with separate 3D regression lines fitted to distinct working zones—such as the upper and lower exterior, and the interior opening and cavity. The resulting segmented axial lines reveal clear discontinuities in direction and offset, providing direct geometric evidence of repositioning events during fabrication. These deviations indicate that the artifact was not rotated continuously on a fixed axis (as in modern lathe work), but instead re-mounted or re-clamped in discrete phases, likely due to ergonomic, tool-access, or material-removal constraints.
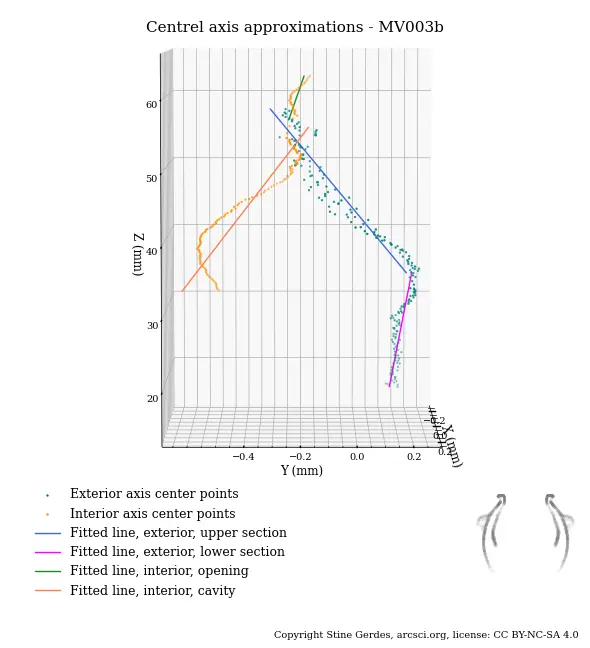 Figure 3 - Central axis visualization of MV003b
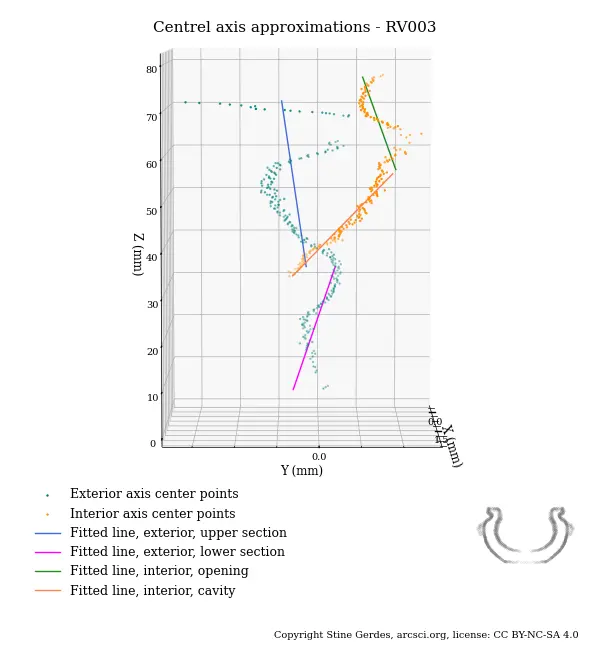 Figure 4 - Central axis visualization of RV003
In all Petrie Museum artifacts analyzed, a consistent pattern emerges: the central axis of the interior surface does not align with that of the exterior, and further, the upper and lower portions of both surfaces often follow distinct sub-axes. Notably, the replica artifact RV003, crafted using only copper tools to simulate ancient techniques, exhibits a nearly identical pattern of axial segmentation.
However, a critical distinction lies in axial stability within each phase. The quantitative results from the 3D line fitting—measured using root mean square deviation (RMSD), standard deviation (SD), and range of residuals, reveal a significant difference in precision between the ancient artifact MV003b and the modern replica RV003:
| Catalogue ID | Area | RMSD | SD | Range | Sample size (slices) | |||
|---|---|---|---|---|---|---|---|---|
| μm | thou | μm | thou | μm | thou | |||
| MV003b | Exterior upper | 64 | 2.5 | 24 | 1.0 | 125 | 4.9 | 115 |
| MV003b | Exterior lower | 32 | 1.3 | 17 | 0.7 | 79 | 3.1 | 95 |
| MV003b | Interior opening | 29 | 1.1 | 14 | 0.6 | 49 | 1.9 | 29 |
| MV003b | Interior cavity | 67 | 2.6 | 27 | 1.1 | 126 | 5.0 | 111 |
| RV003 | Exterior upper | 312 | 12.3 | 170 | 6.7 | 972 | 38.3 | 167 |
| RV003 | Exterior lower | 105 | 4.1 | 57 | 2.3 | 324 | 12.8 | 102 |
| RV003 | Interior opening | 293 | 11.5 | 164 | 6.5 | 912 | 35.9 | 89 |
| RV003 | Interior cavity | 152 | 6.0 | 74 | 2.9 | 371 | 14.6 | 124 |
Table 1 - Axial stability comparison between MV003b (Petrie artifact) and RV003 (replica)
The data show that MV003b, despite being over 4,000 years old, maintains far greater coaxial stability within each working phase than the modern replica. For example:
The low SD values for MV003b indicate that once positioned, the artifact was worked with extraordinary rigidity and uniformity, likely using a stable support system, precise tool guidance, and a refined abrasive technique that minimized drift.
In contrast, the higher variability in RV003, especially in the upper sections, suggests challenges in maintaining consistent pressure, tool alignment, or blank fixation during hand rotation.
These findings highlight a crucial insight: repositioning was a necessary part of the process, but the ancient artisan mastered it with a level of high intra-phase stability that modern replication struggles to match.
A forthcoming article will expand this analysis to include a broader dataset: additional artifacts from the Petrie Museum (including a softer calcite vessel for material comparison), objects from private collections and 16 modern CNC-lathed vases. This comparative study will quantify the consistency and magnitude of coaxial deviations, contrasting the variability of ancient Egyptian vessels with the mathematical perfection of machine manufacturing.
One of the most compelling findings from this analysis is the superior geometric precision achieved on the interior surfaces of several ancient Egyptian stone vessels, often exceeding that of their exteriors. This result is counterintuitive: the interior working of a hardstone vessel presents significant physical constraints. Access is limited, tool motion is restricted, and direct visual control is minimal. In modern manufacturing, such conditions would typically lead to reduced accuracy. Yet, in multiple artifacts from the Petrie collection, the internal geometry exhibits near-perfect circularity, minimal surface variation, and exceptional coaxial alignment—indicating a level of control that rivals precision machining.
To explore this phenomenon in detail, we focus on MV003b (Petrie ID: UC15604), a small basalt vessel from the Predynastic period, renowned for its refined craftsmanship. The overall Precision Score for such objects aggregates three primary sources of geometric deviation:
1) Repositioning errors (misalignments introduced when the artifact was remounted during multi-stage shaping)
2) Coaxial instability (drift or tilt in the central rotational axis during working)
3) Tool-induced deviations (local irregularities caused by the material removal process)
In earlier analyses, these error sources are conflated. However, by segmenting the 3D scan data according to discrete working phases, corresponding to stable mounting periods, we can isolate and remove repositioning misalignment. This refinement allows us to assess the intrinsic precision of the toolwork and rotational control during each uninterrupted phase of fabrication. The resulting metrics reflect only deviations from (2) and (3), offering a purer measure of the artisan’s real-time skill in maintaining symmetry and surface regularity.
Further decomposition, through slicing the interior and exterior profiles and fitting best-fit circles, enables distinction between systematic coaxial drift and localized tool inaccuracies. While a full error decomposition will be detailed in a forthcoming publication, intermediate metrics are already available in the published precision reports for expert analysis.
Localized Precision Across Surface Regions
Table 2 quantify regional variations in precision, Root Mean Square Deviation (RMSD) and Range (peak-to-valley deviation) between the scanned surface and the derived best-fit model for four key regions: Interior Opening, Interior Cavity, Exterior upper and Exterior lower.
| Catalogue ID | Area | Sample height | Precision score | RMSD | SD | Range | Sample size | ||||
|---|---|---|---|---|---|---|---|---|---|---|---|
| mm | in | μm | thou | μm | thou | μm | thou | ||||
| MV003b | Interior Opening | 5 | 0.197 | 987 | 32 | 1.3 | 21 | 0.8 | 251 | 9.9 | 12715 |
| MV003b | Interior Cavity | 24 | 0.9 | 223 | 67 | 2.6 | 40 | 1.6 | 485 | 19.1 | 43291 |
| MV003b | Exterior upper | 24 | 0.9 | 19 | 230 | 9.1 | 122 | 4.8 | 1245 | 49.0 | 46150 |
| MV003b | Exterior lower | 18 | 0.7 | 52 | 128 | 5.0 | 84 | 3.3 | 885 | 34.8 | 25564 |
| RV003 | Interior opening | 10 | 0.4 | 8.6 | 336 | 13.2 | 213 | 8.4 | 2402 | 94.6 | 10280 |
| RV003 | Interior cavity | 35 | 1.4 | 3 | 570 | 22.4 | 327 | 12.9 | 3204 | 126.1 | 58270 |
| RV003 | Exterior upper | 28 | 1.1 | 2.44 | 640 | 25.2 | 370 | 14.6 | 3618 | 142.4 | 32298 |
| RV003 | Exterior lower | 30 | 1.2 | 2.59 | 621 | 24.4 | 409 | 16.1 | 3335 | 131.3 | 53138 |
Table 2 compares the precision at the different axial shifts of artifact MV003b, RV003 (replica made with primitive tools).
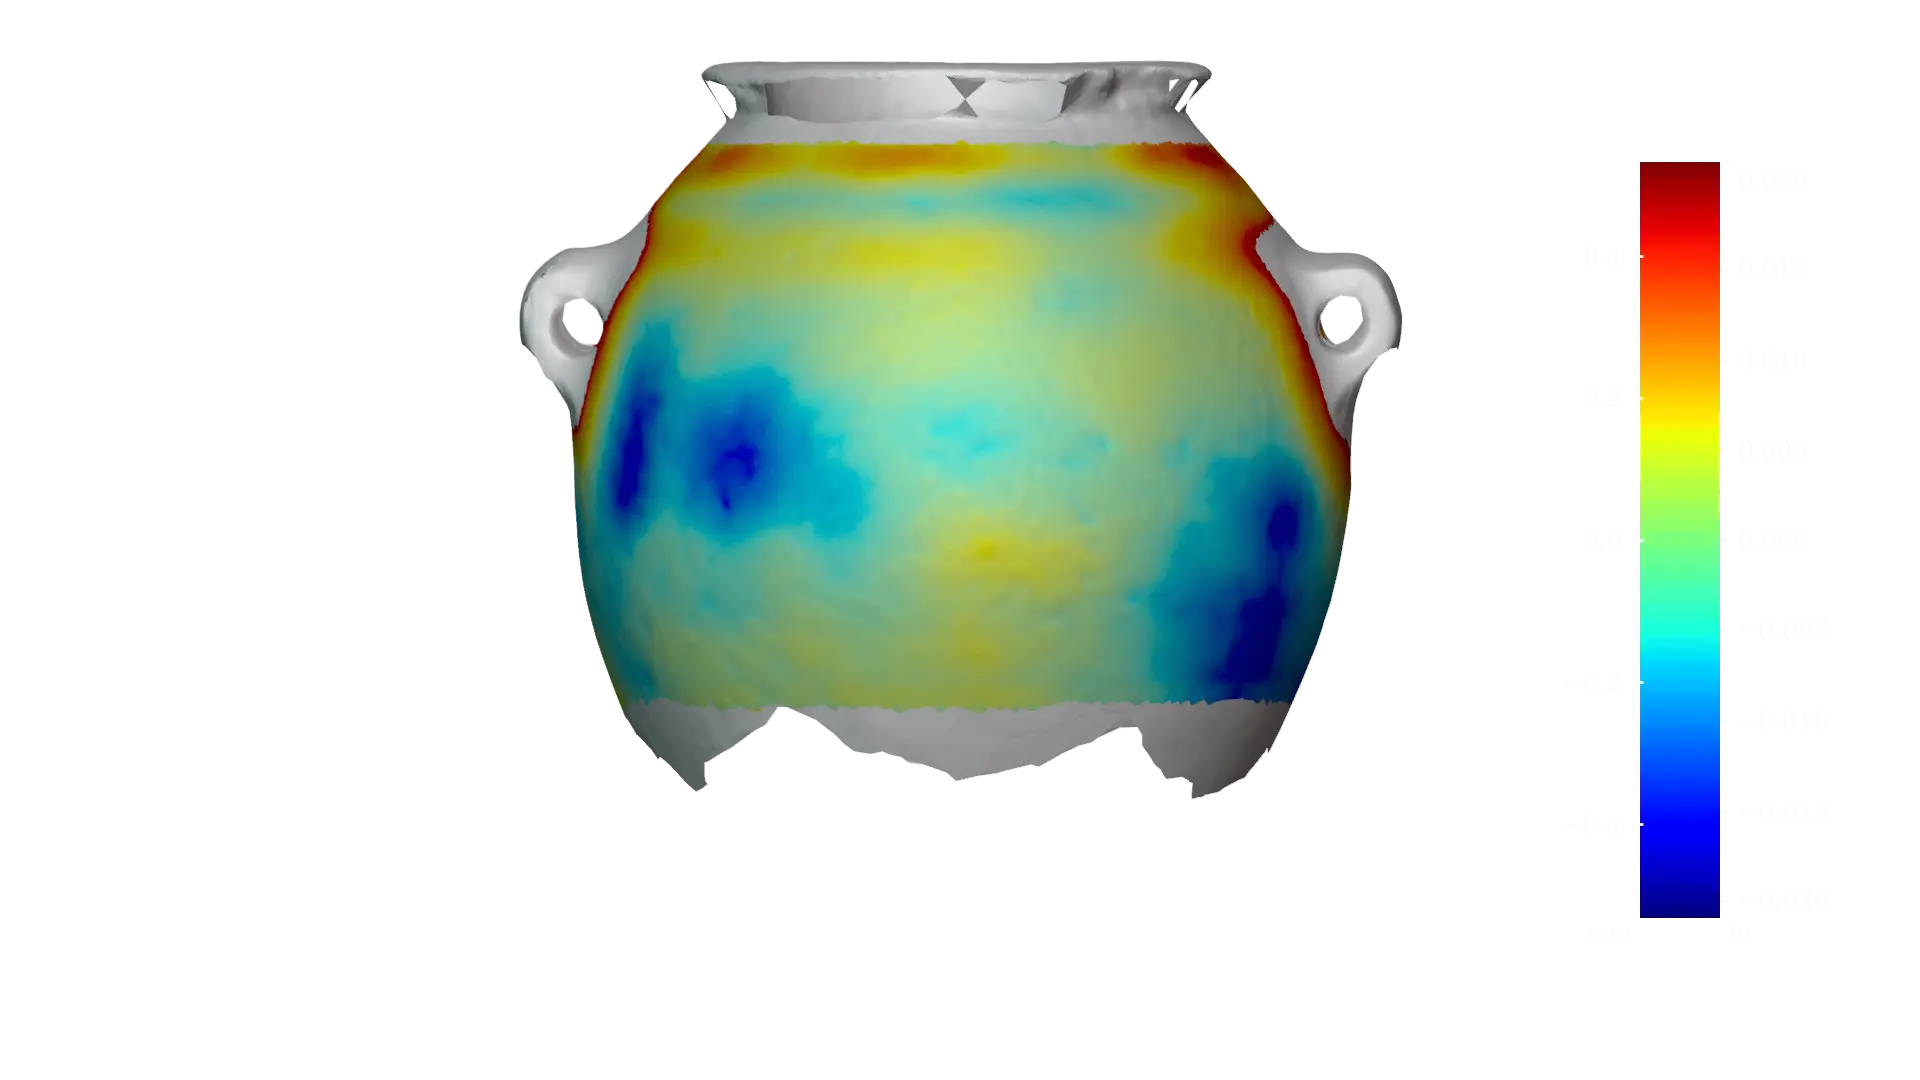
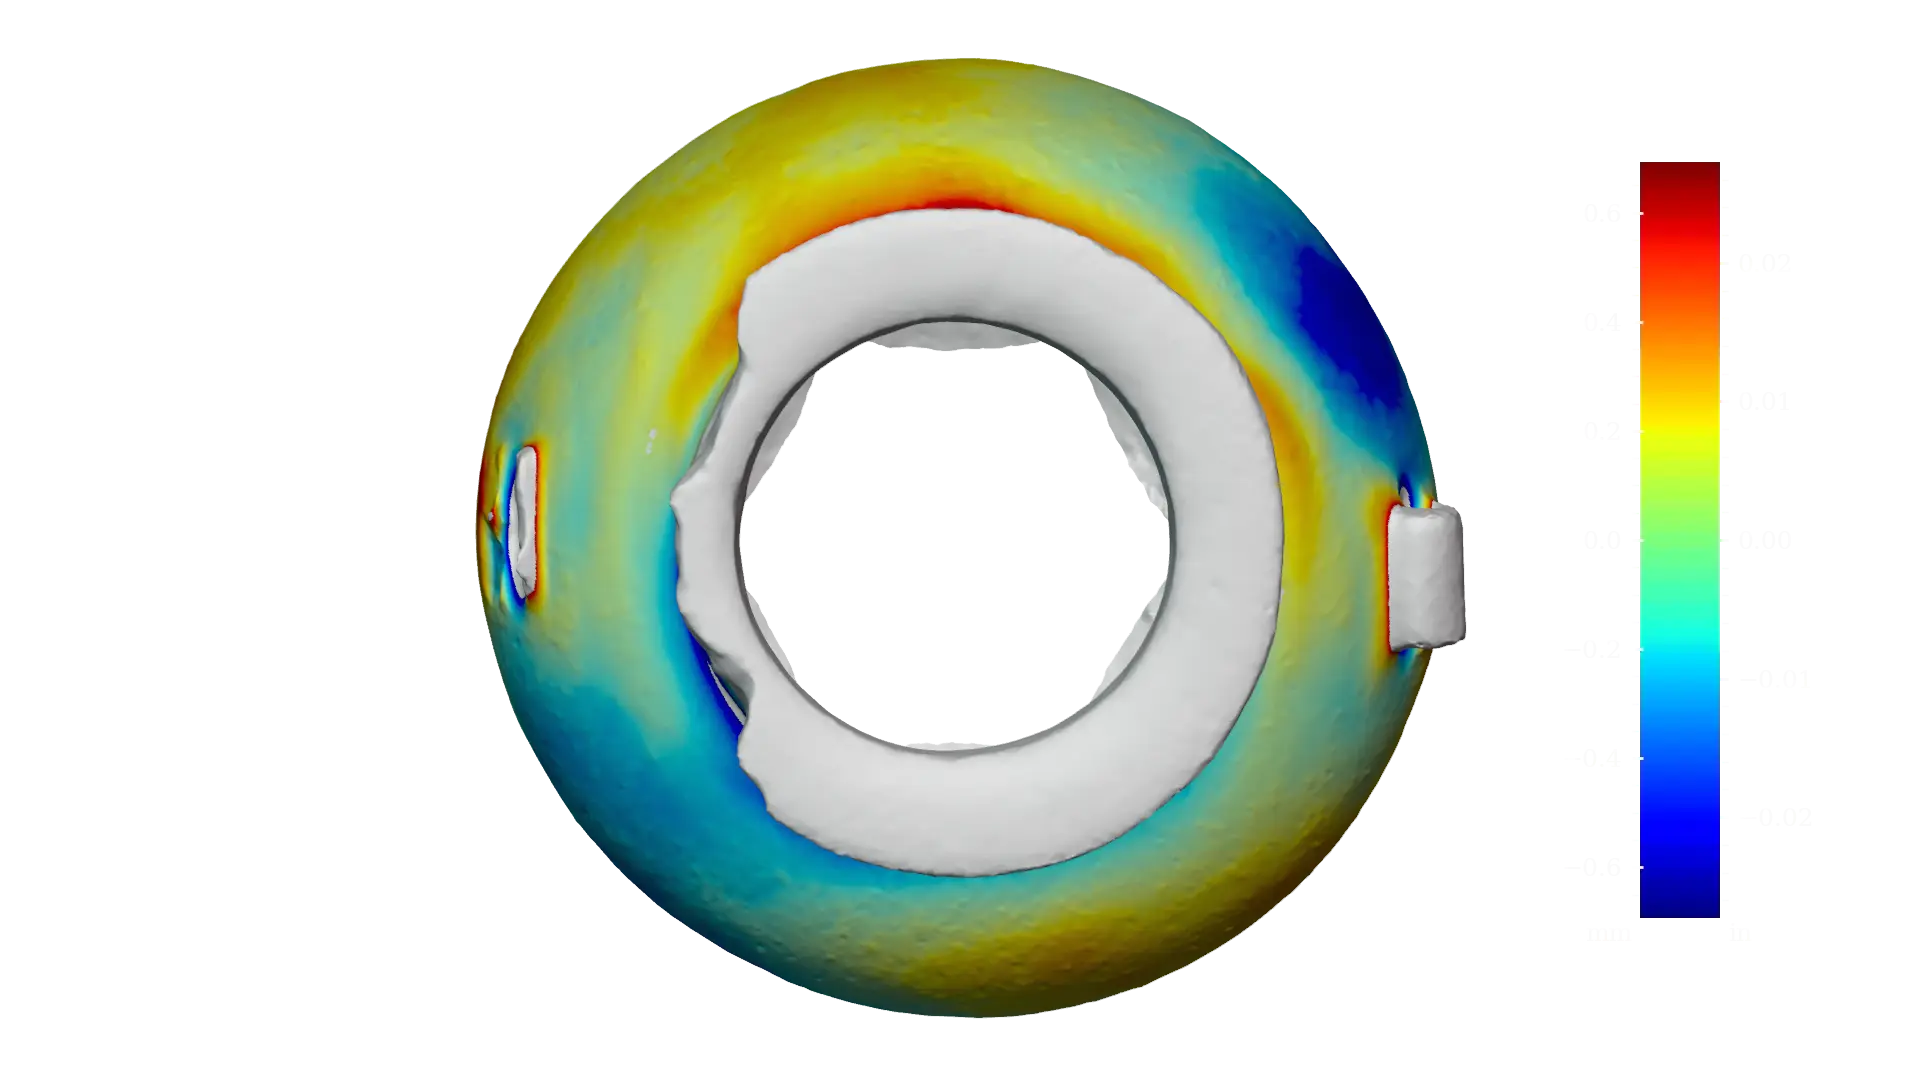
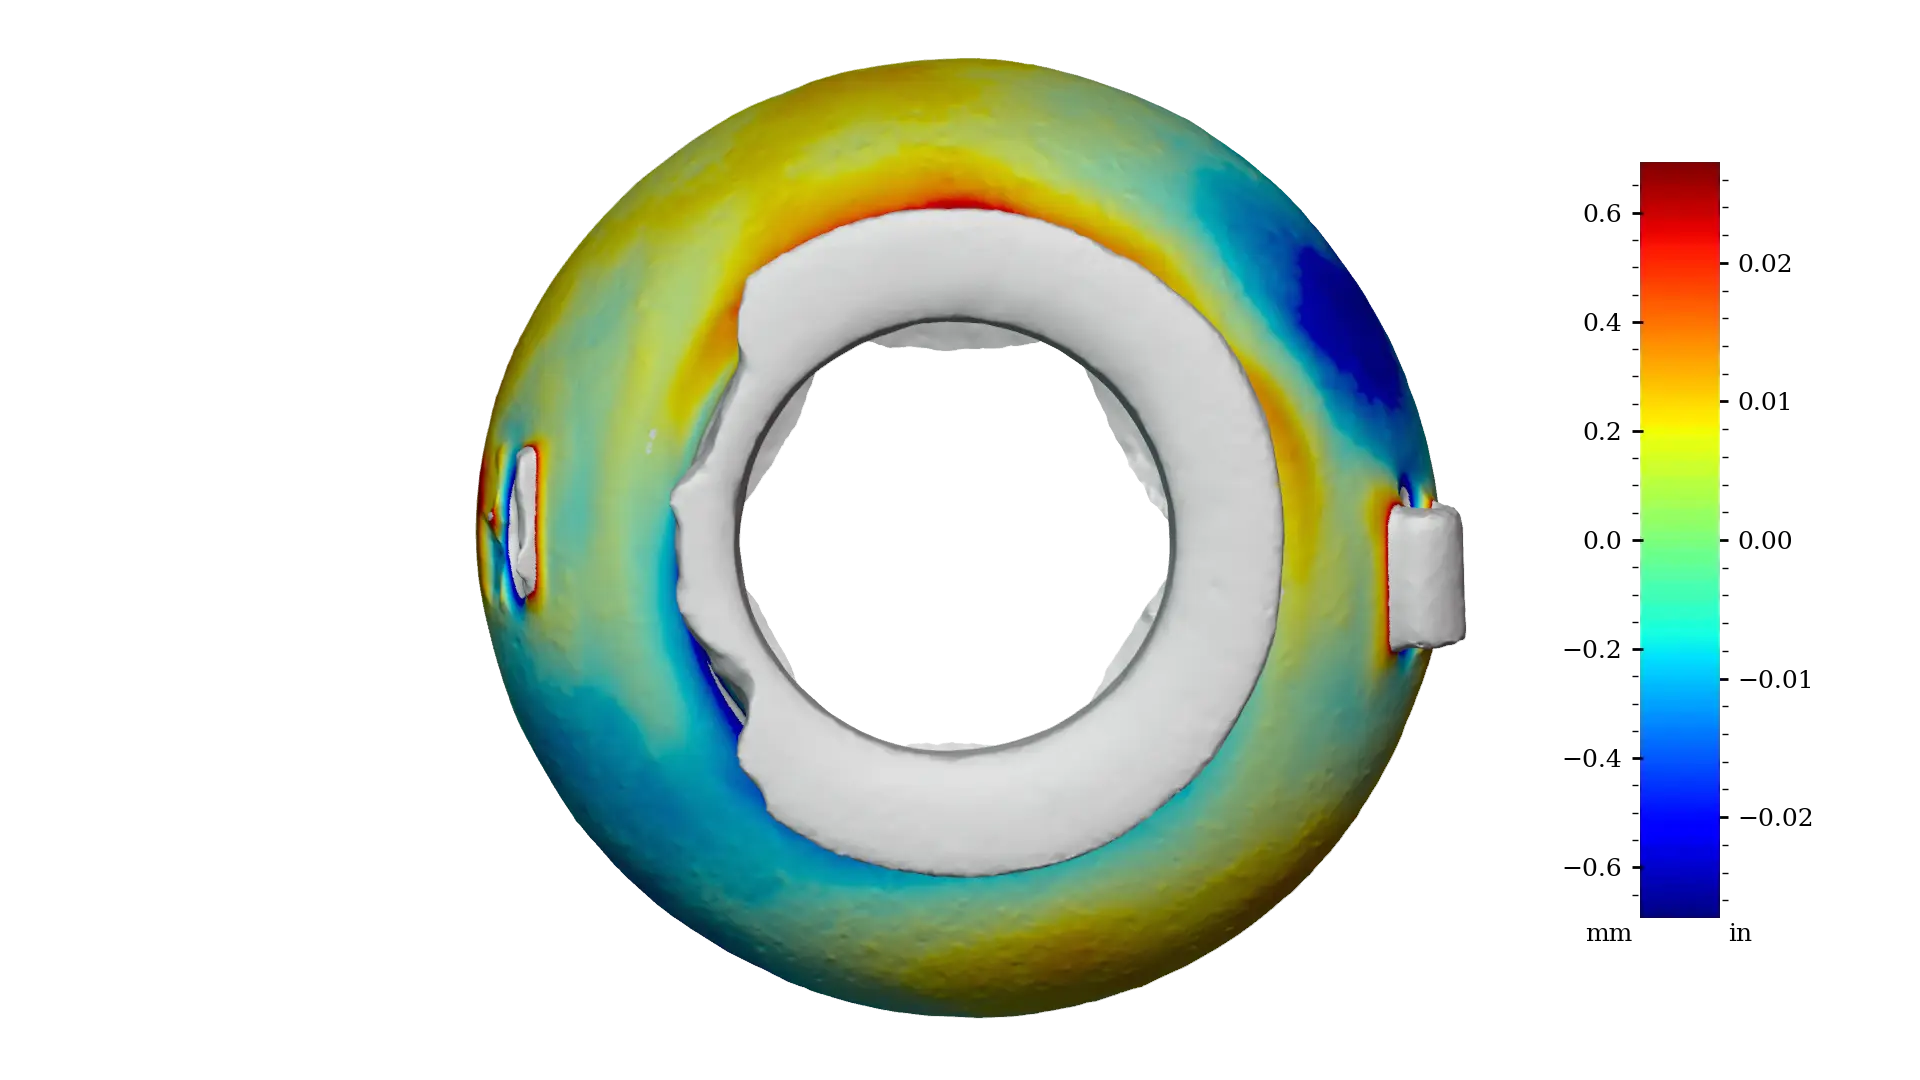
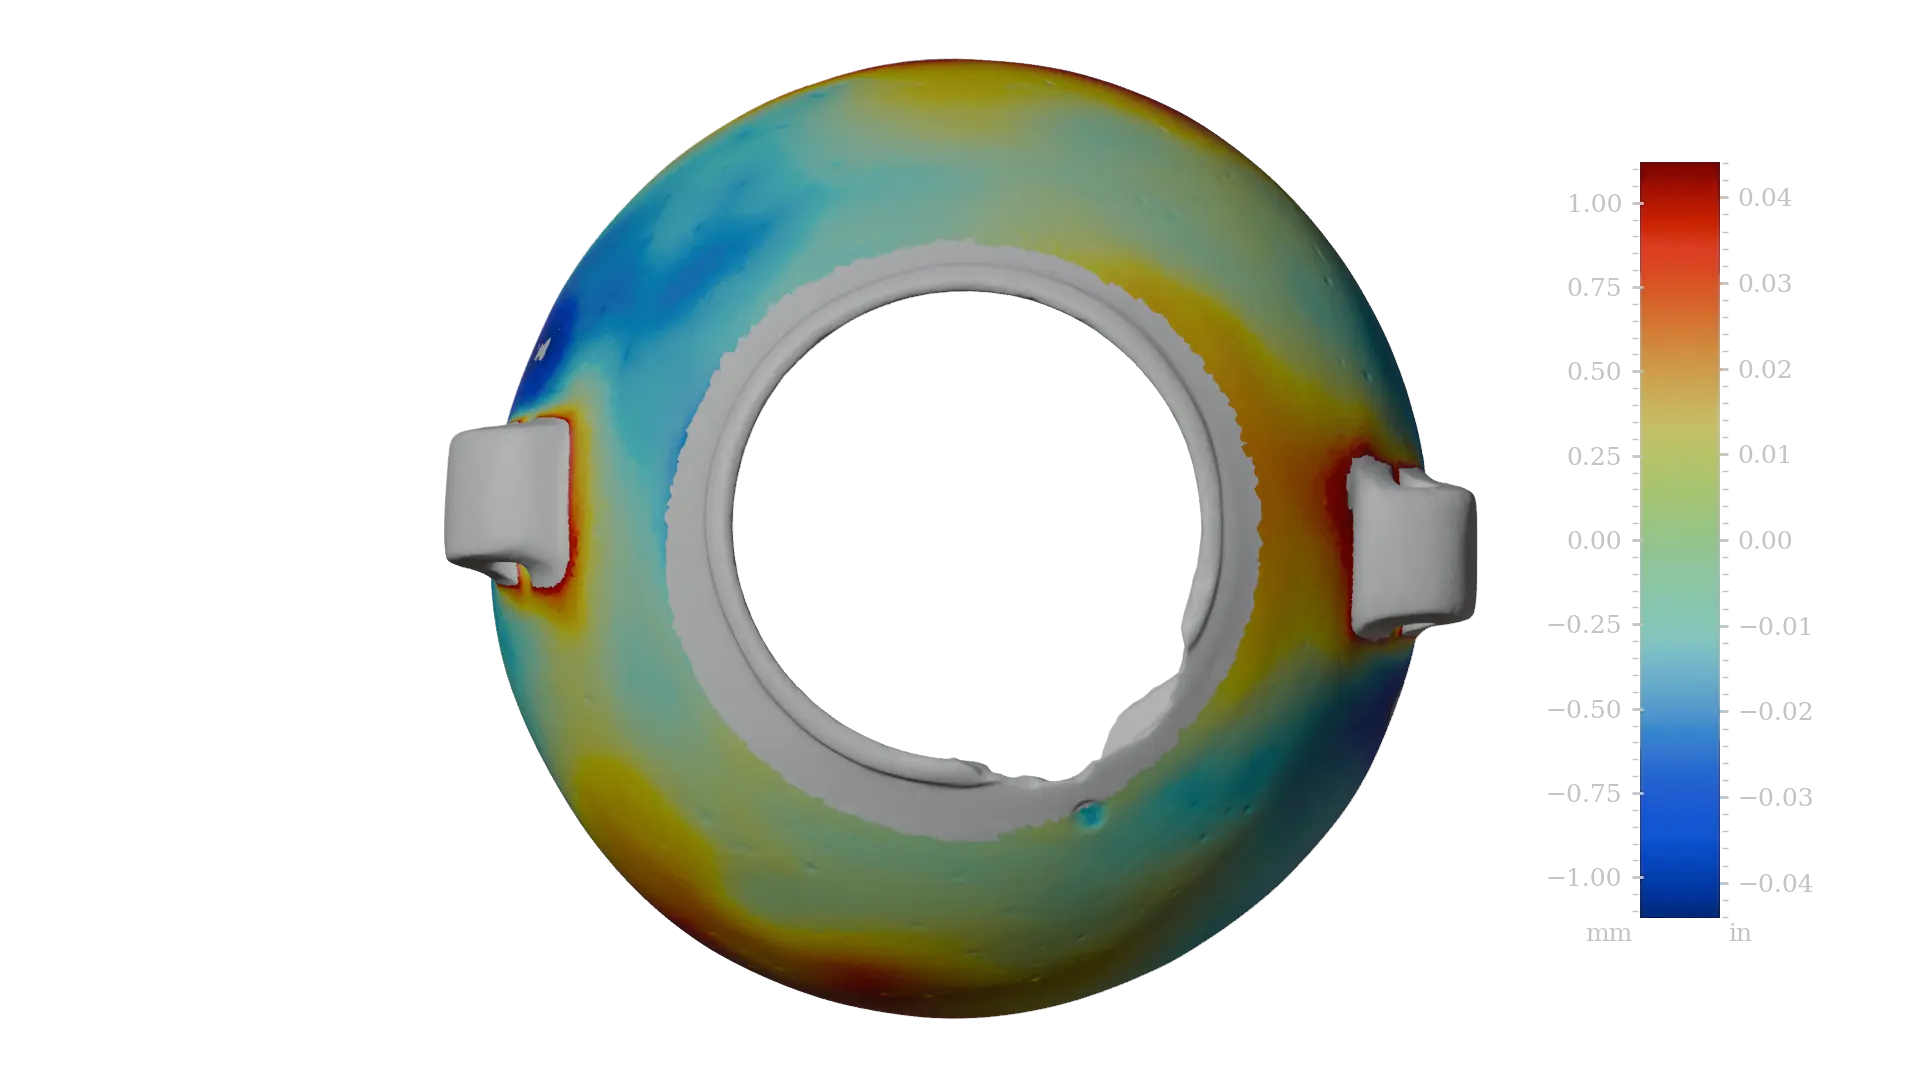
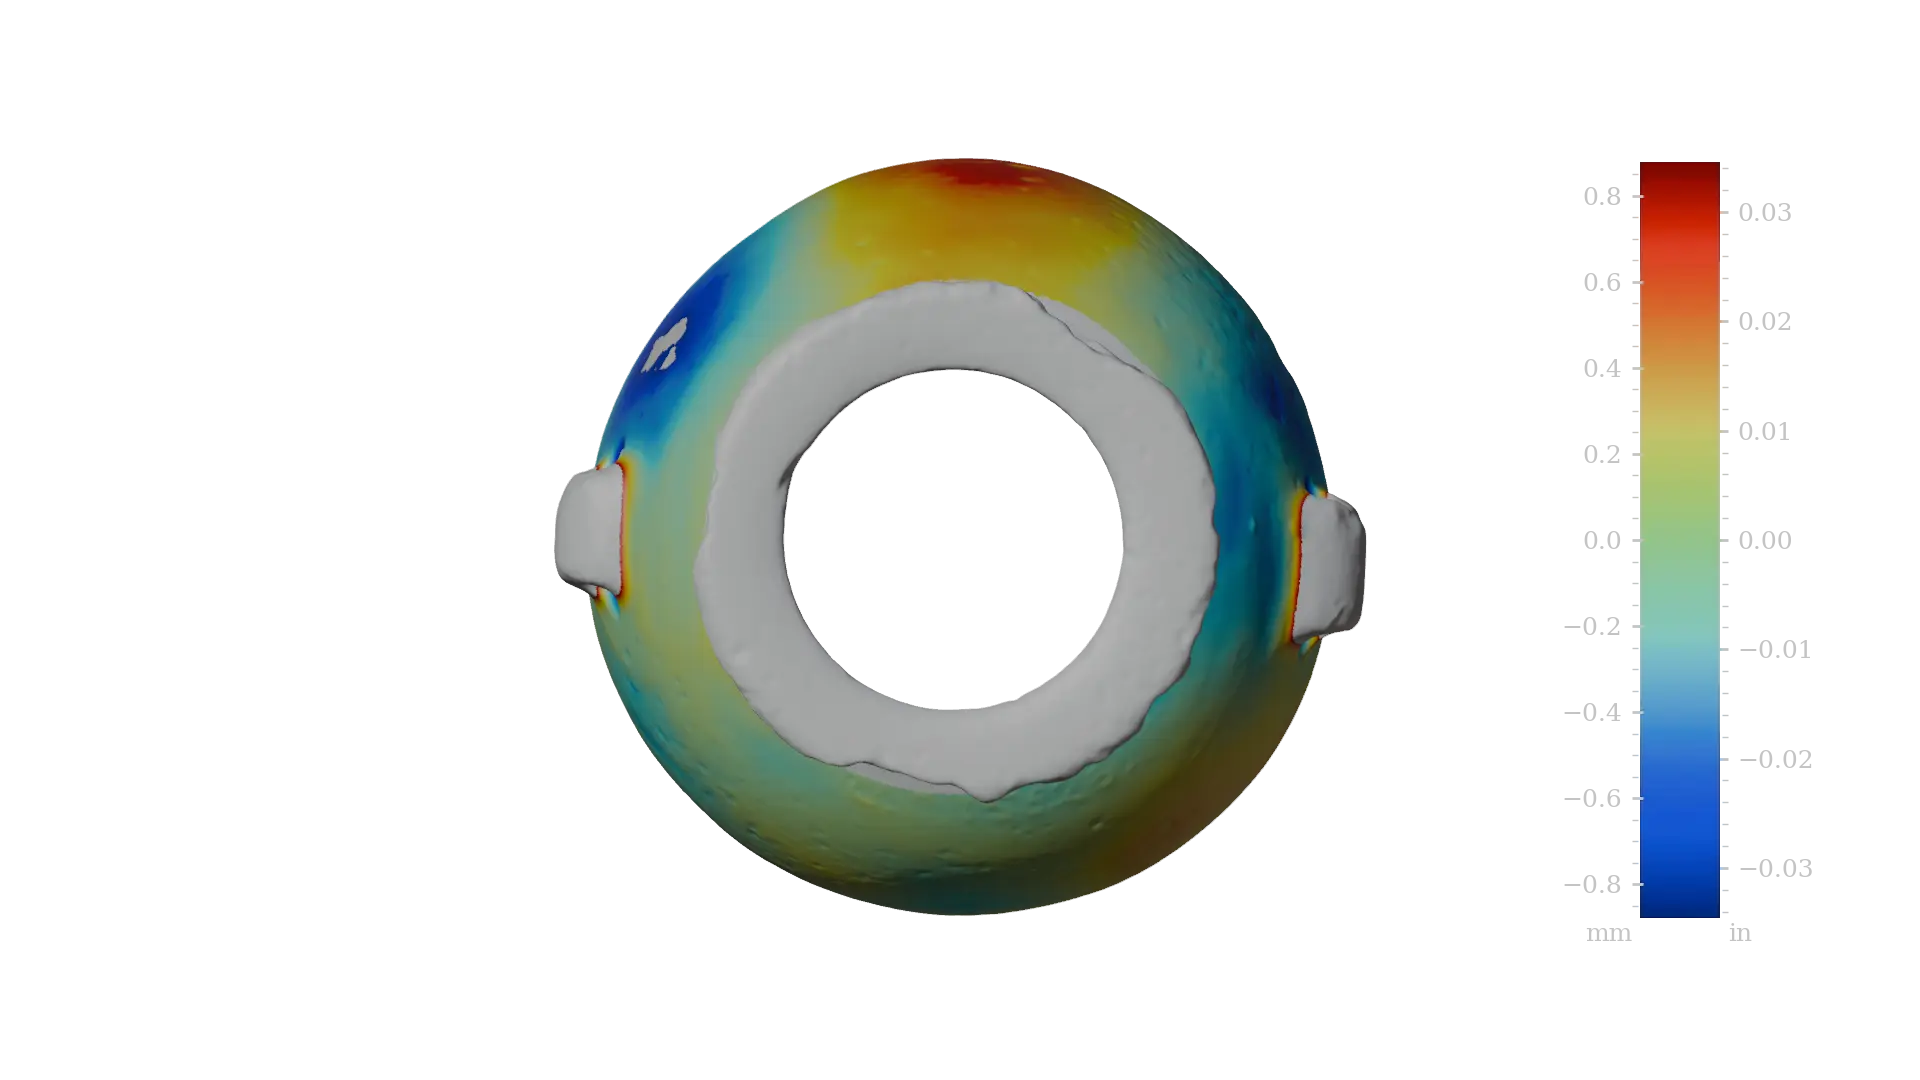
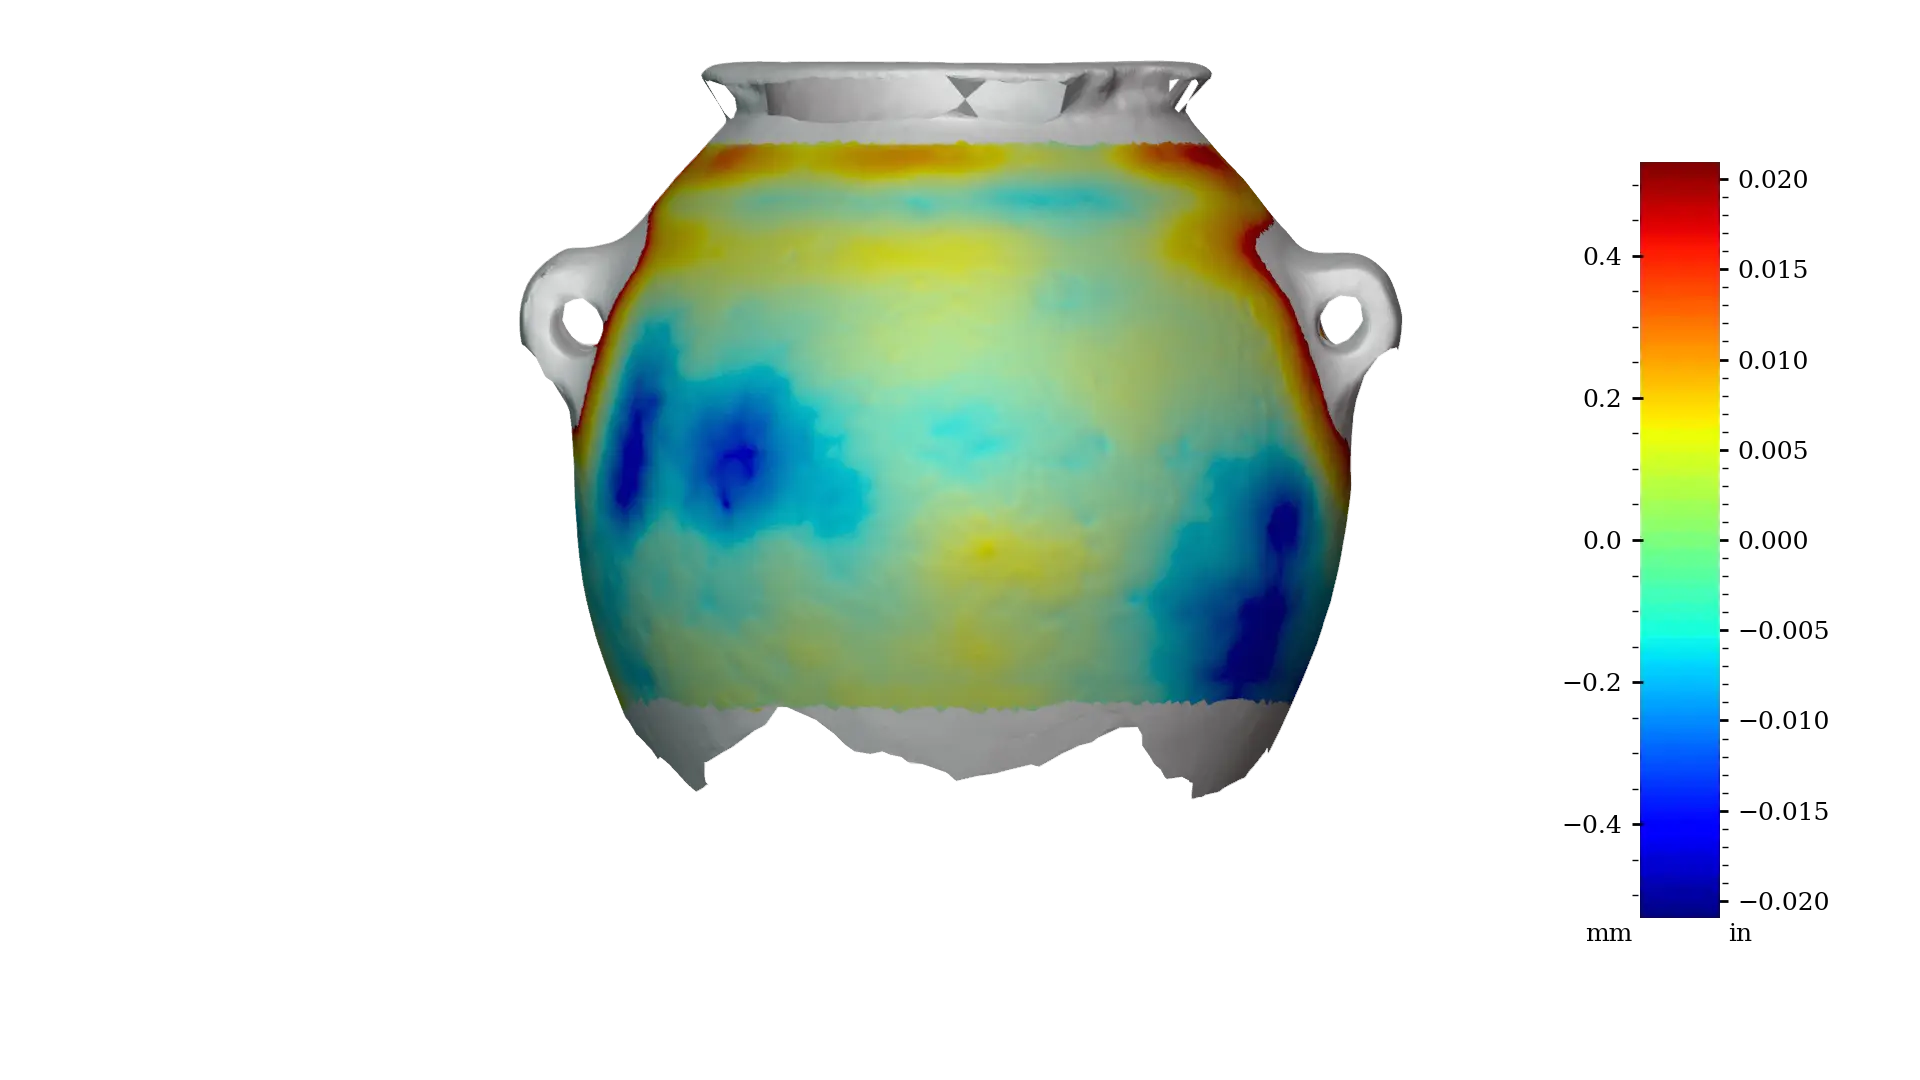 Figure 5 - MV003b exterior full
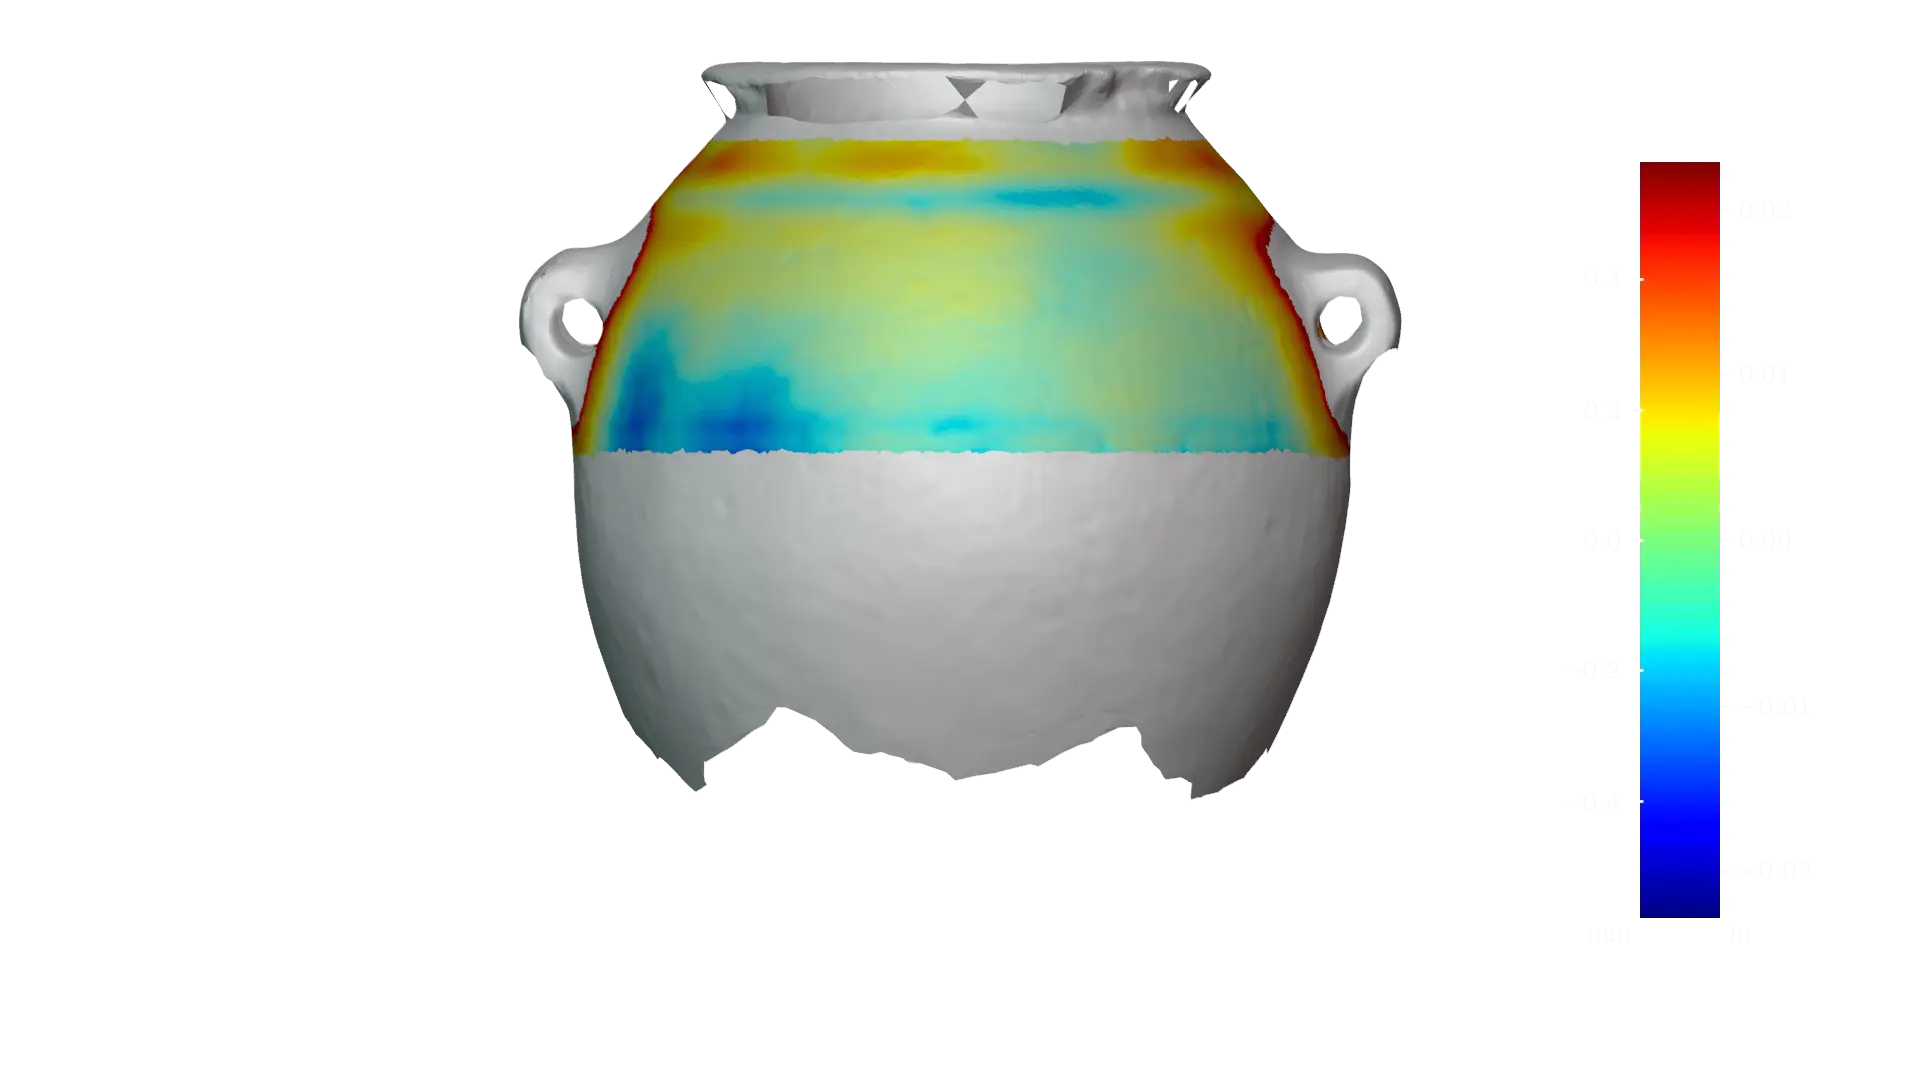
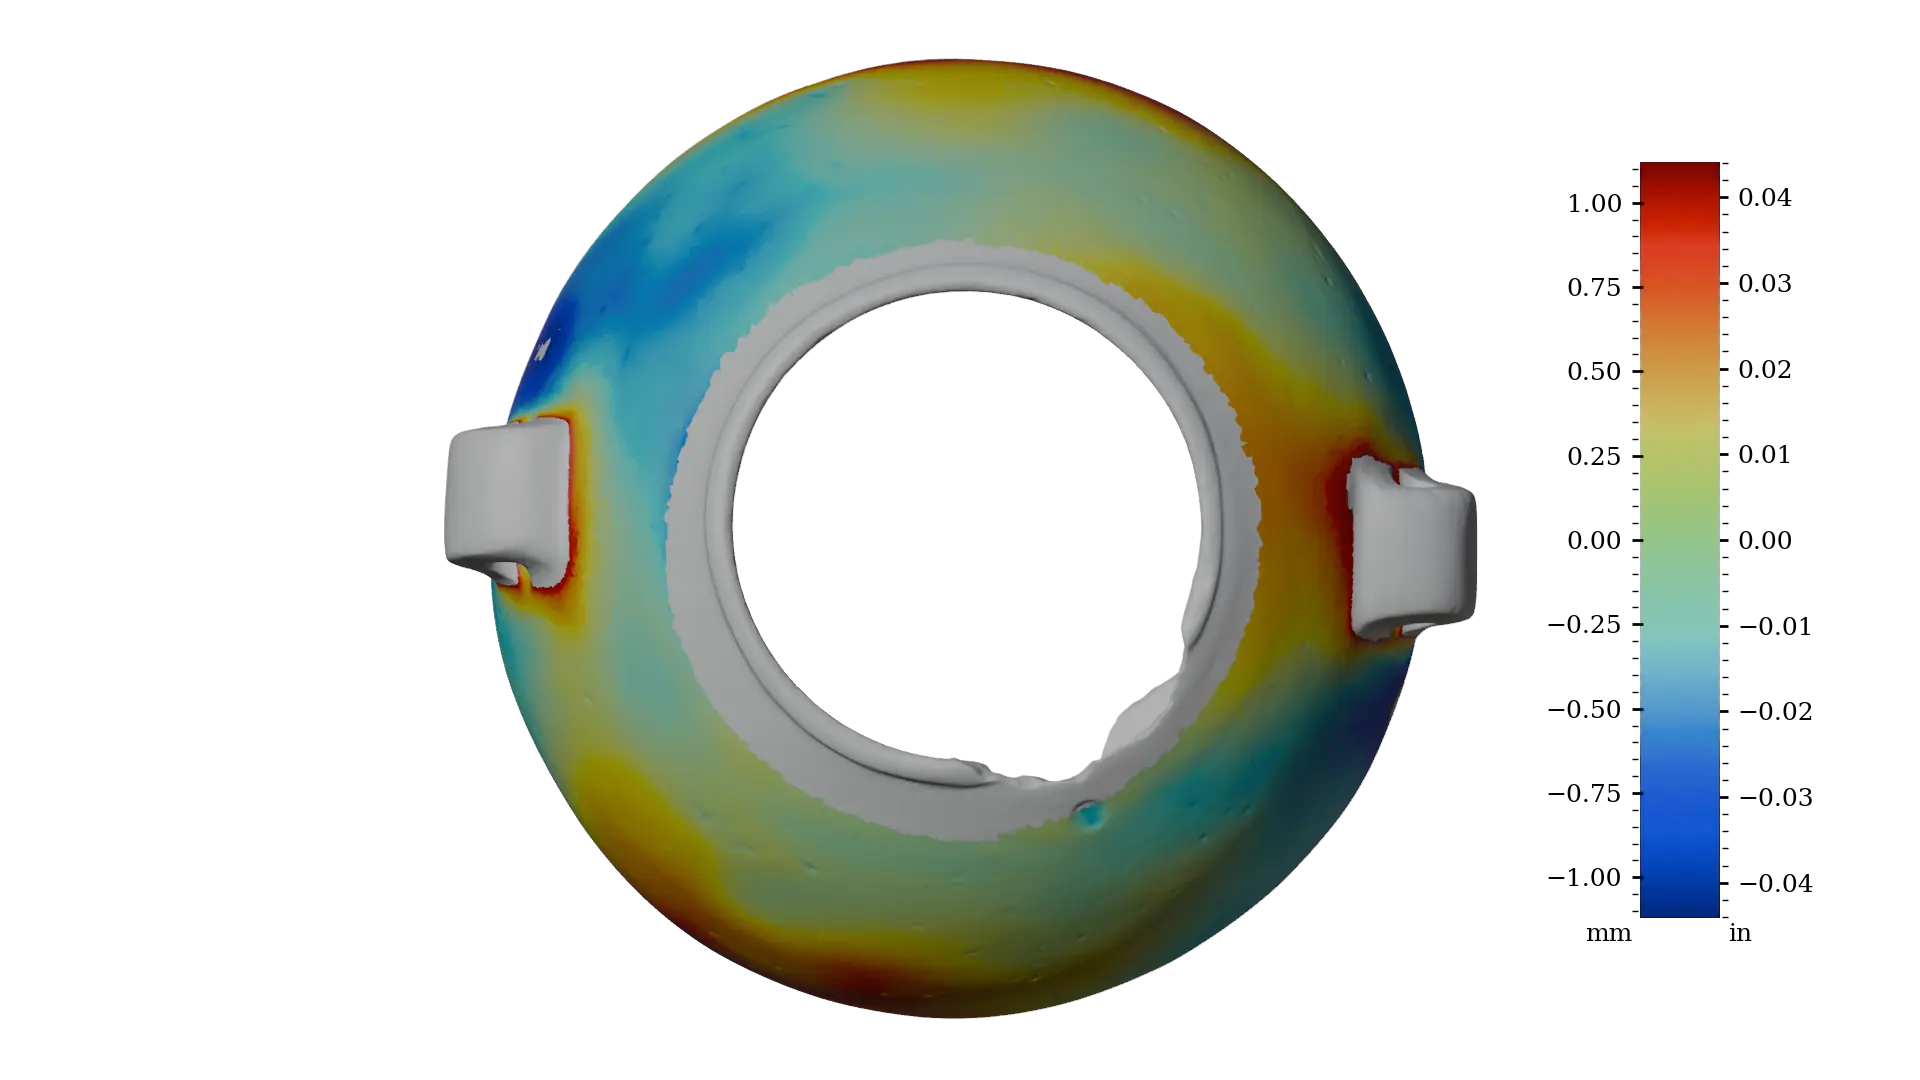
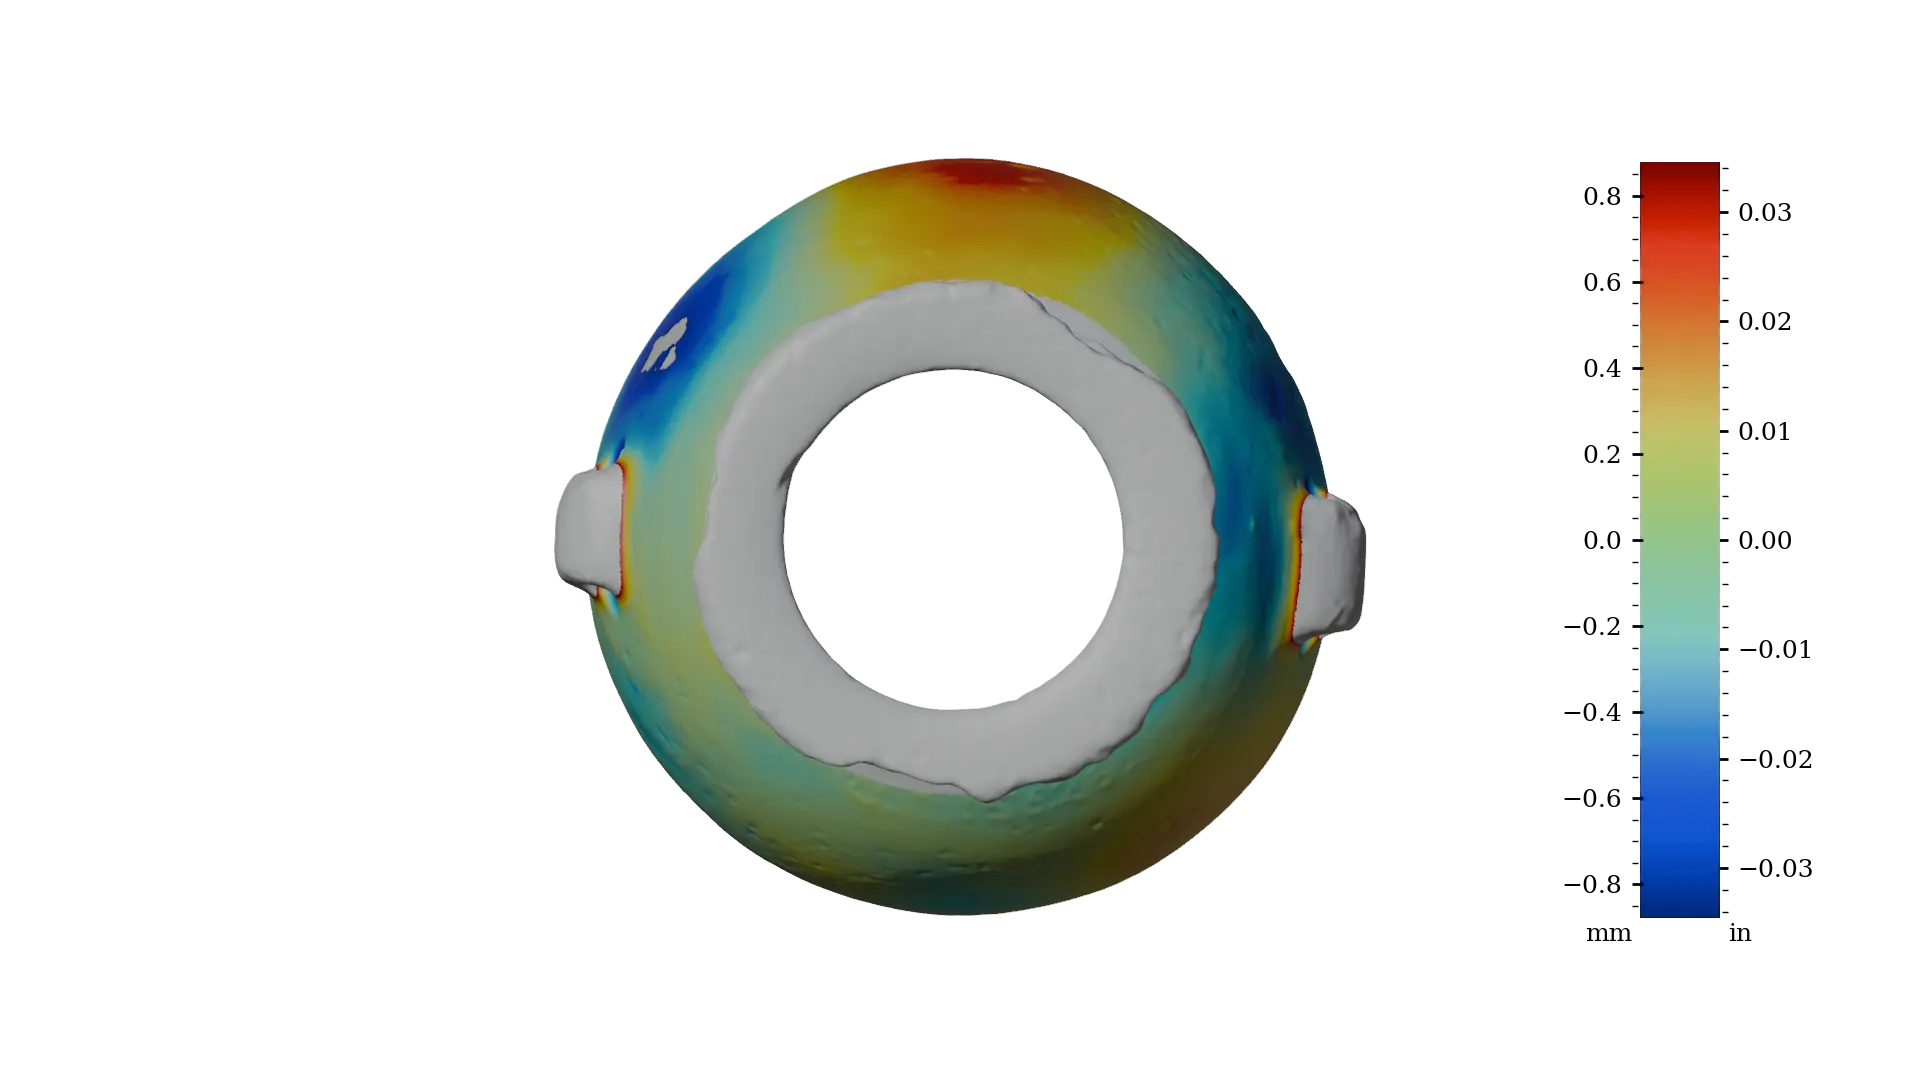
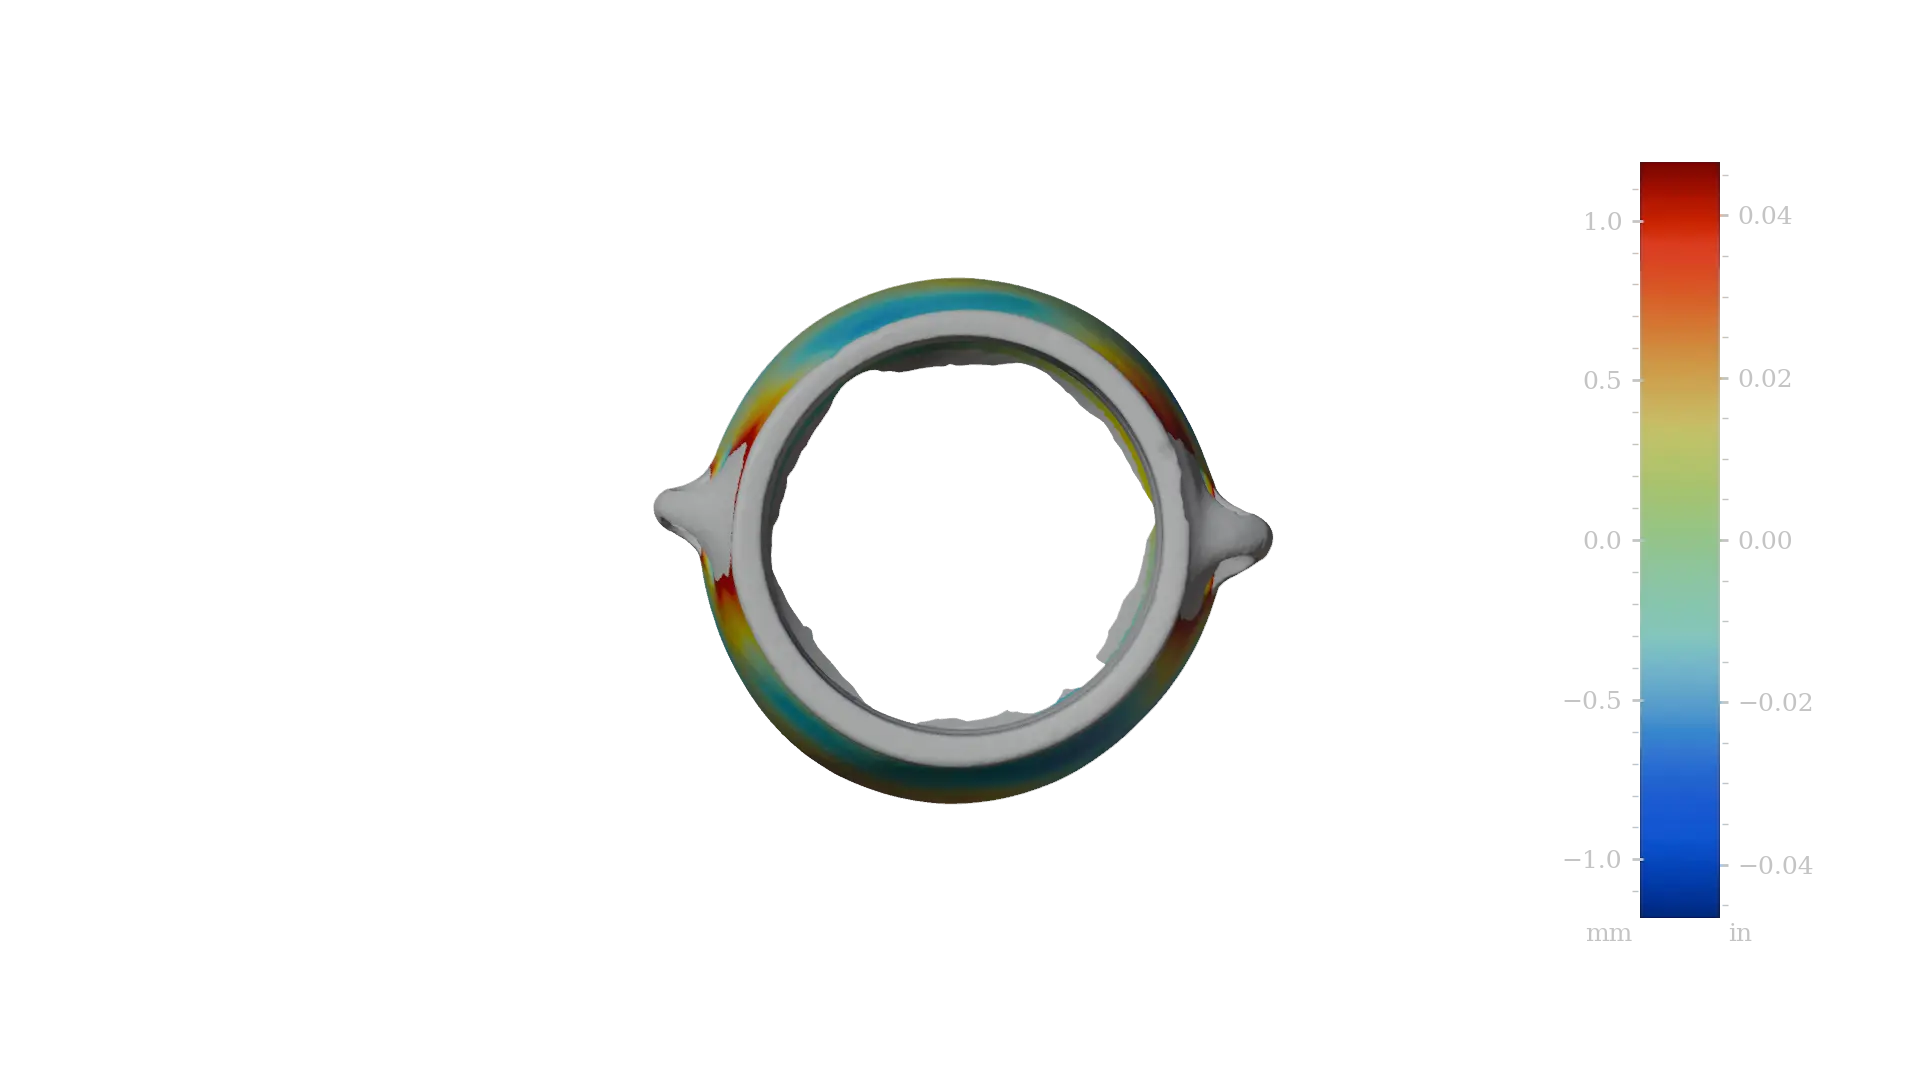
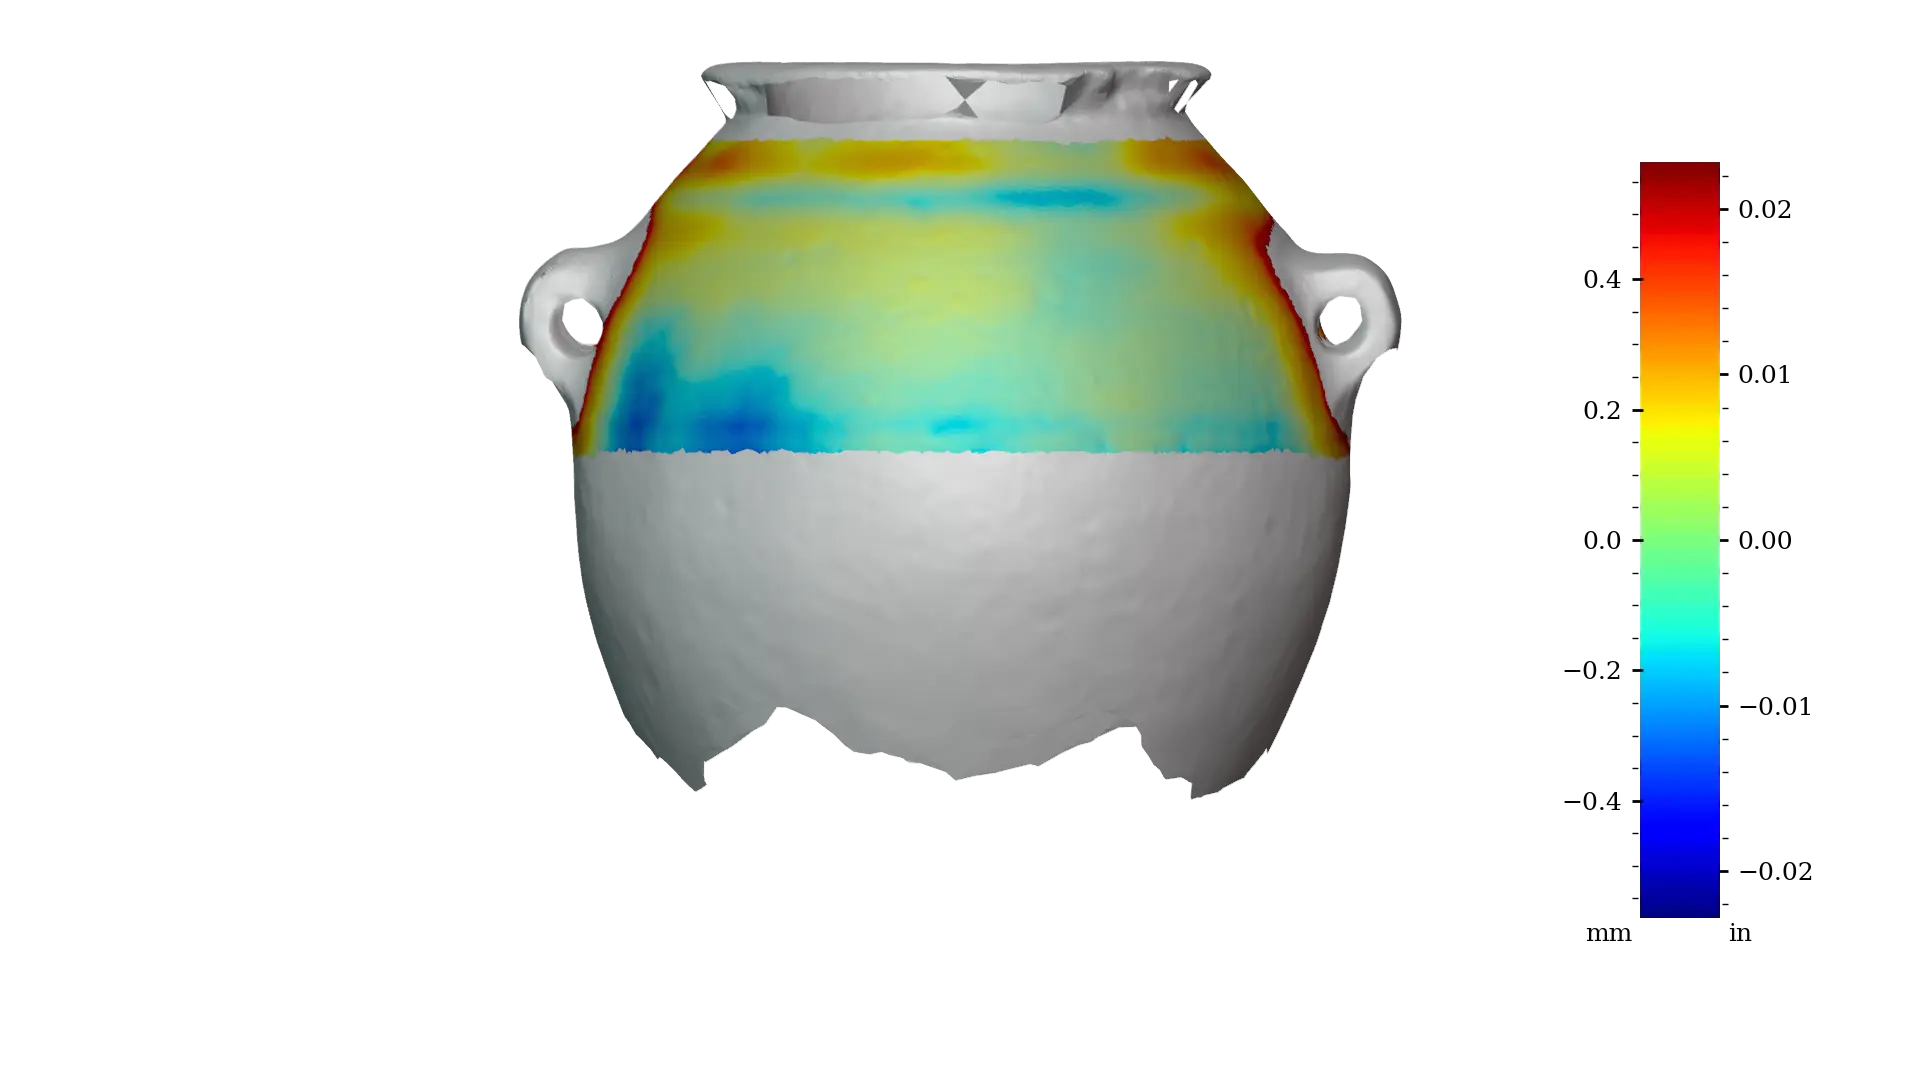 Figure 6 - MV003b exterior upper
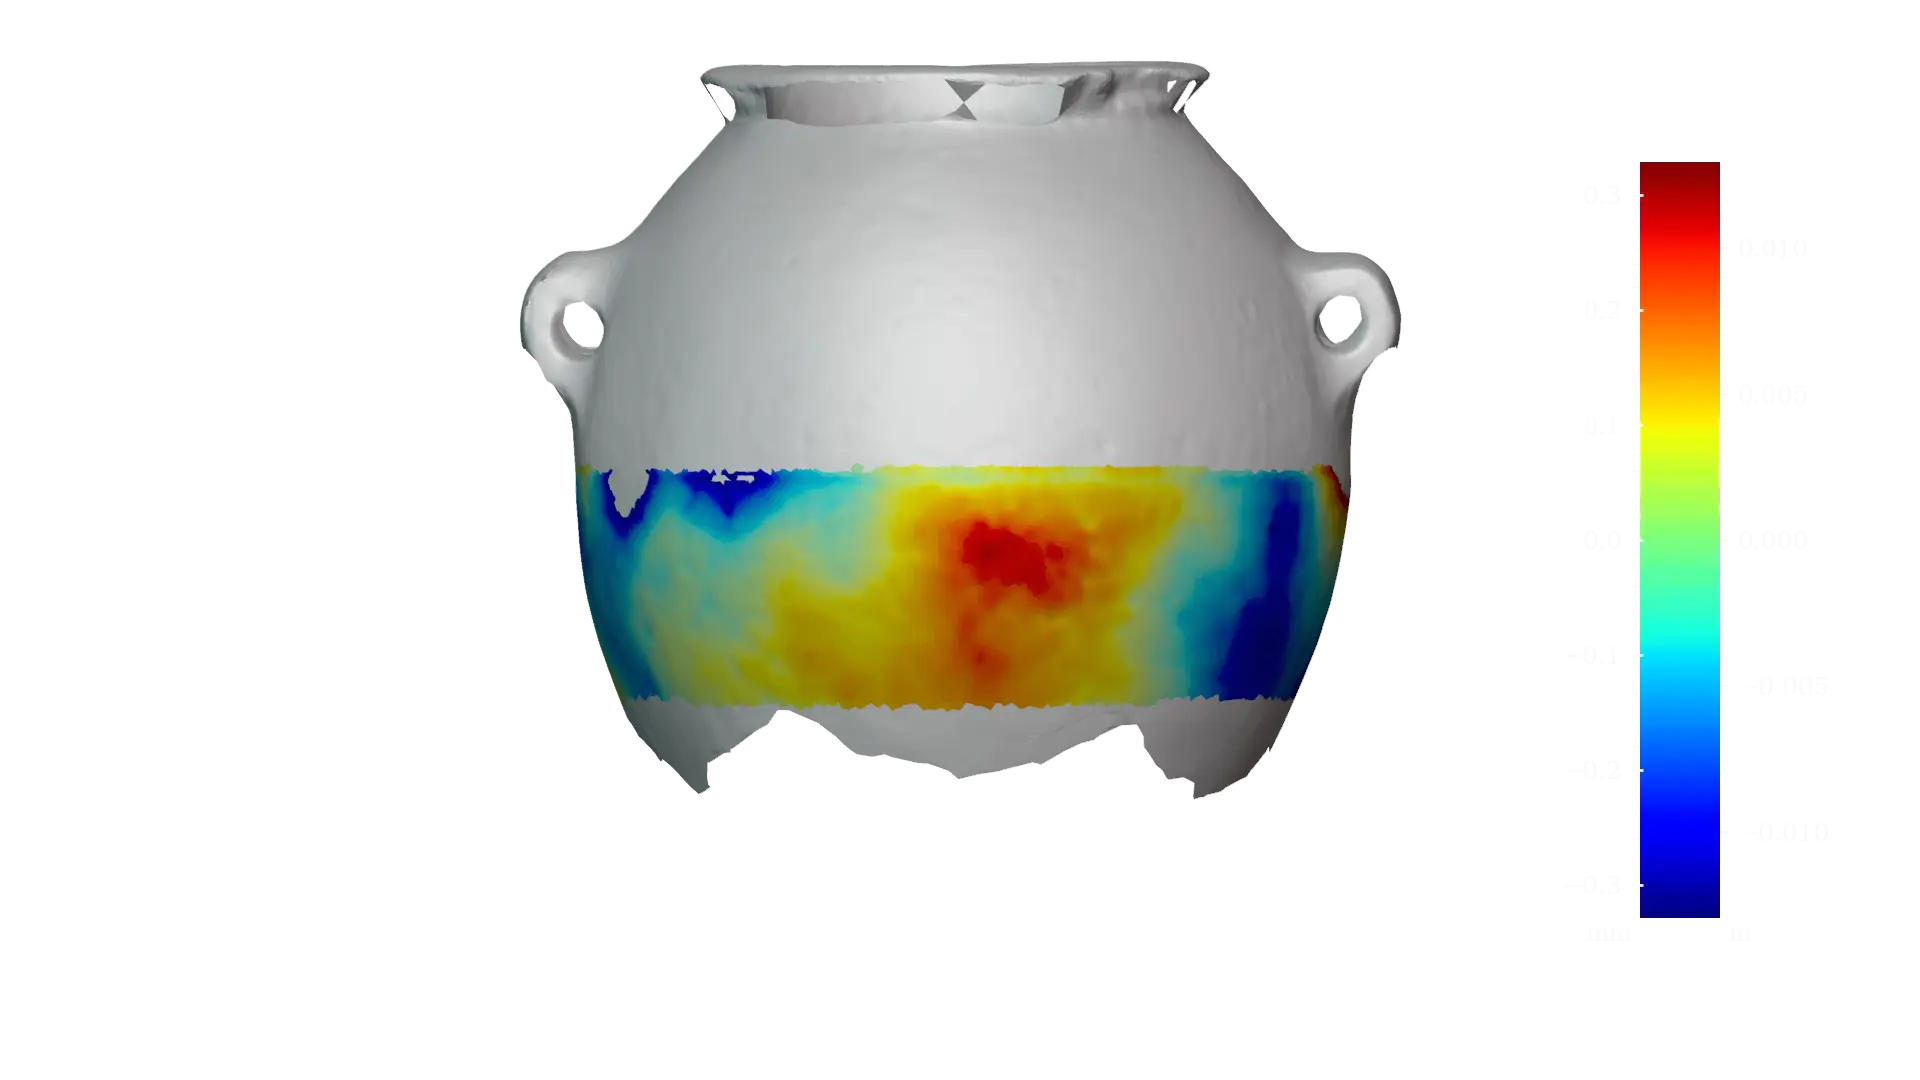
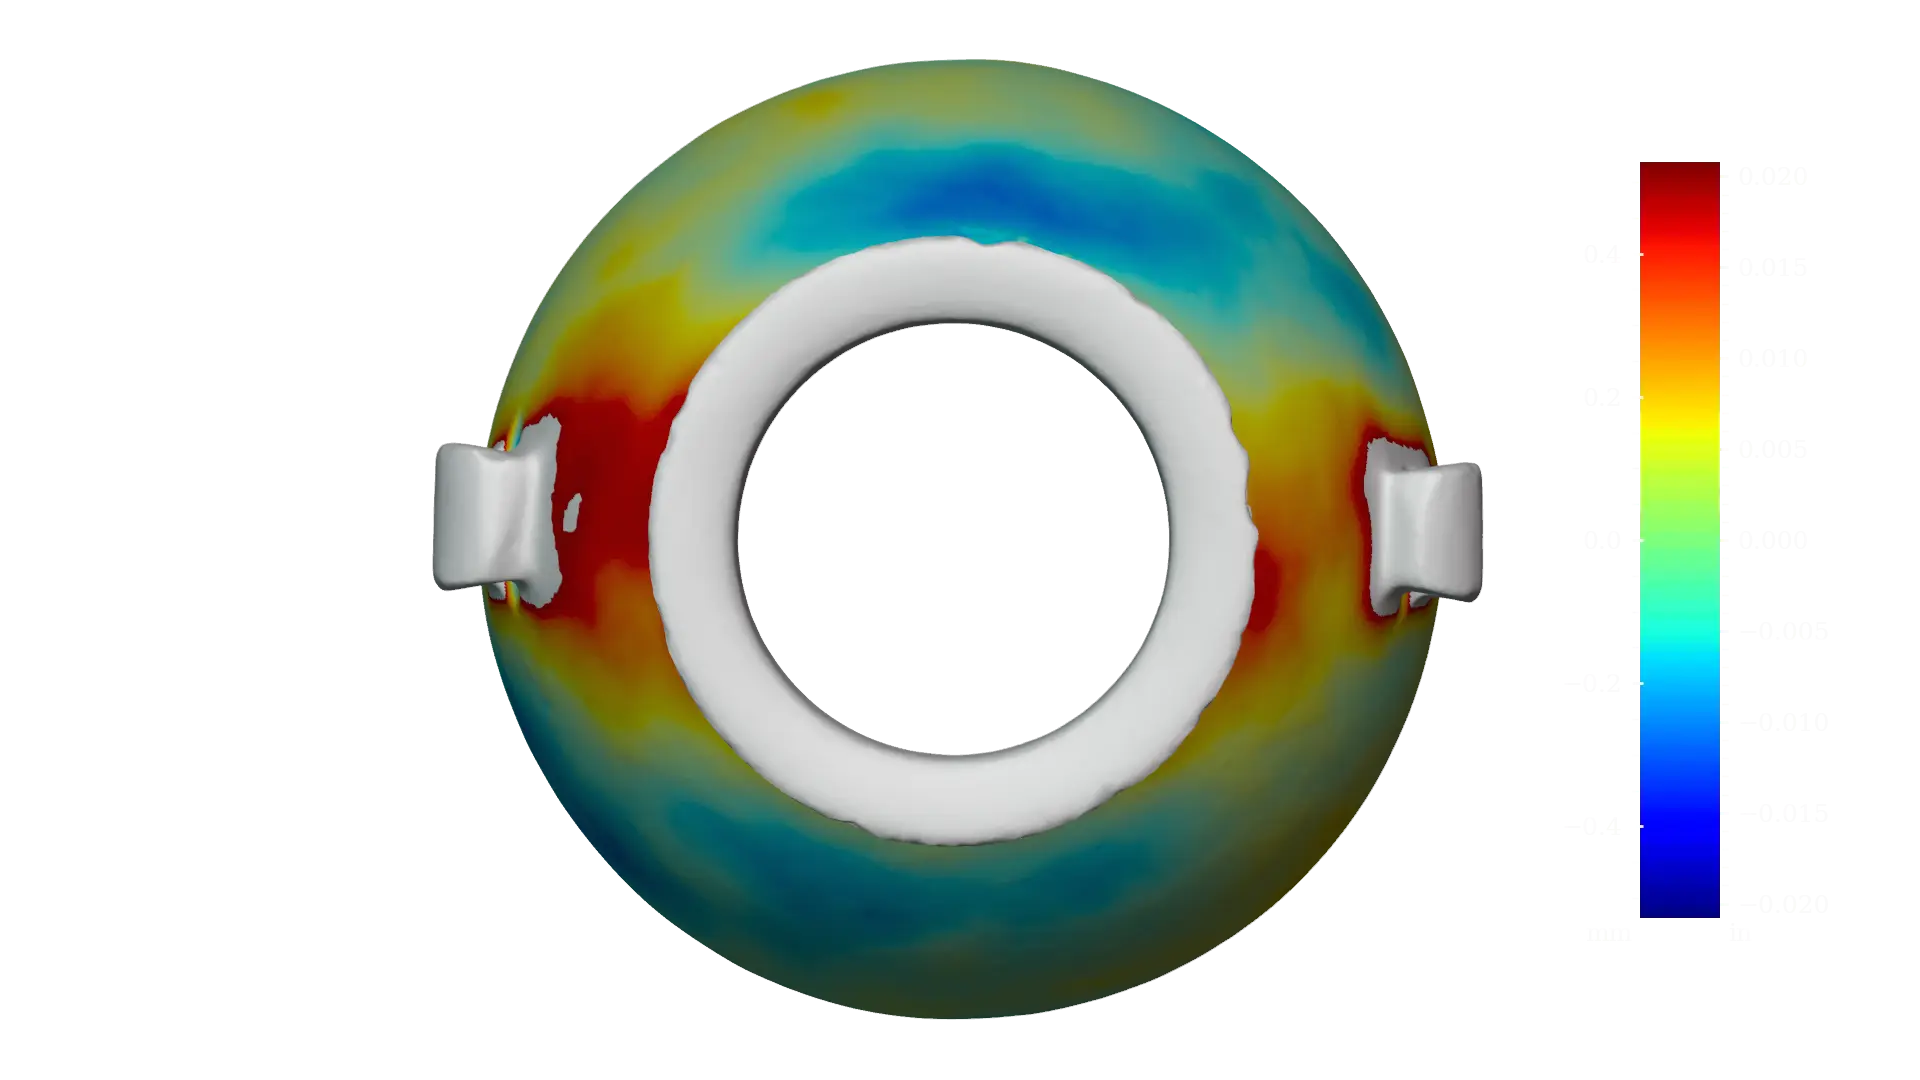
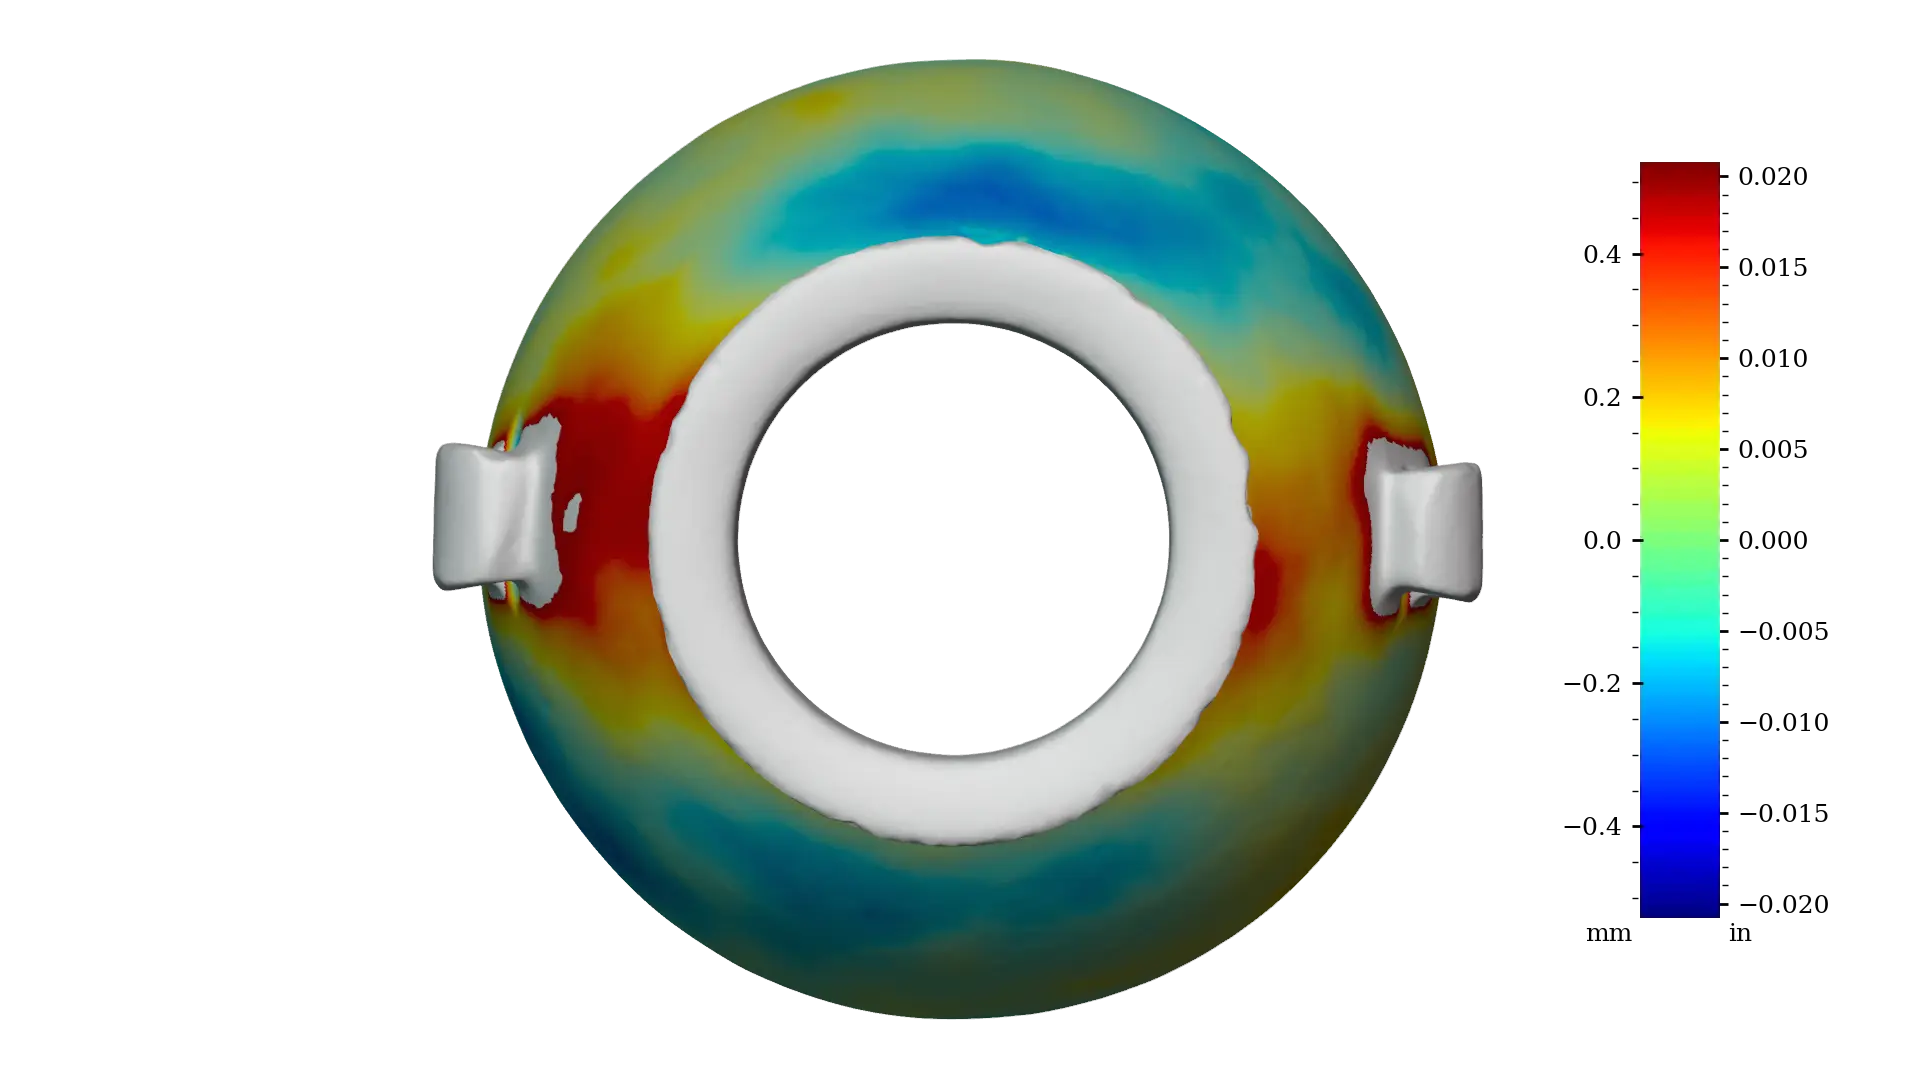
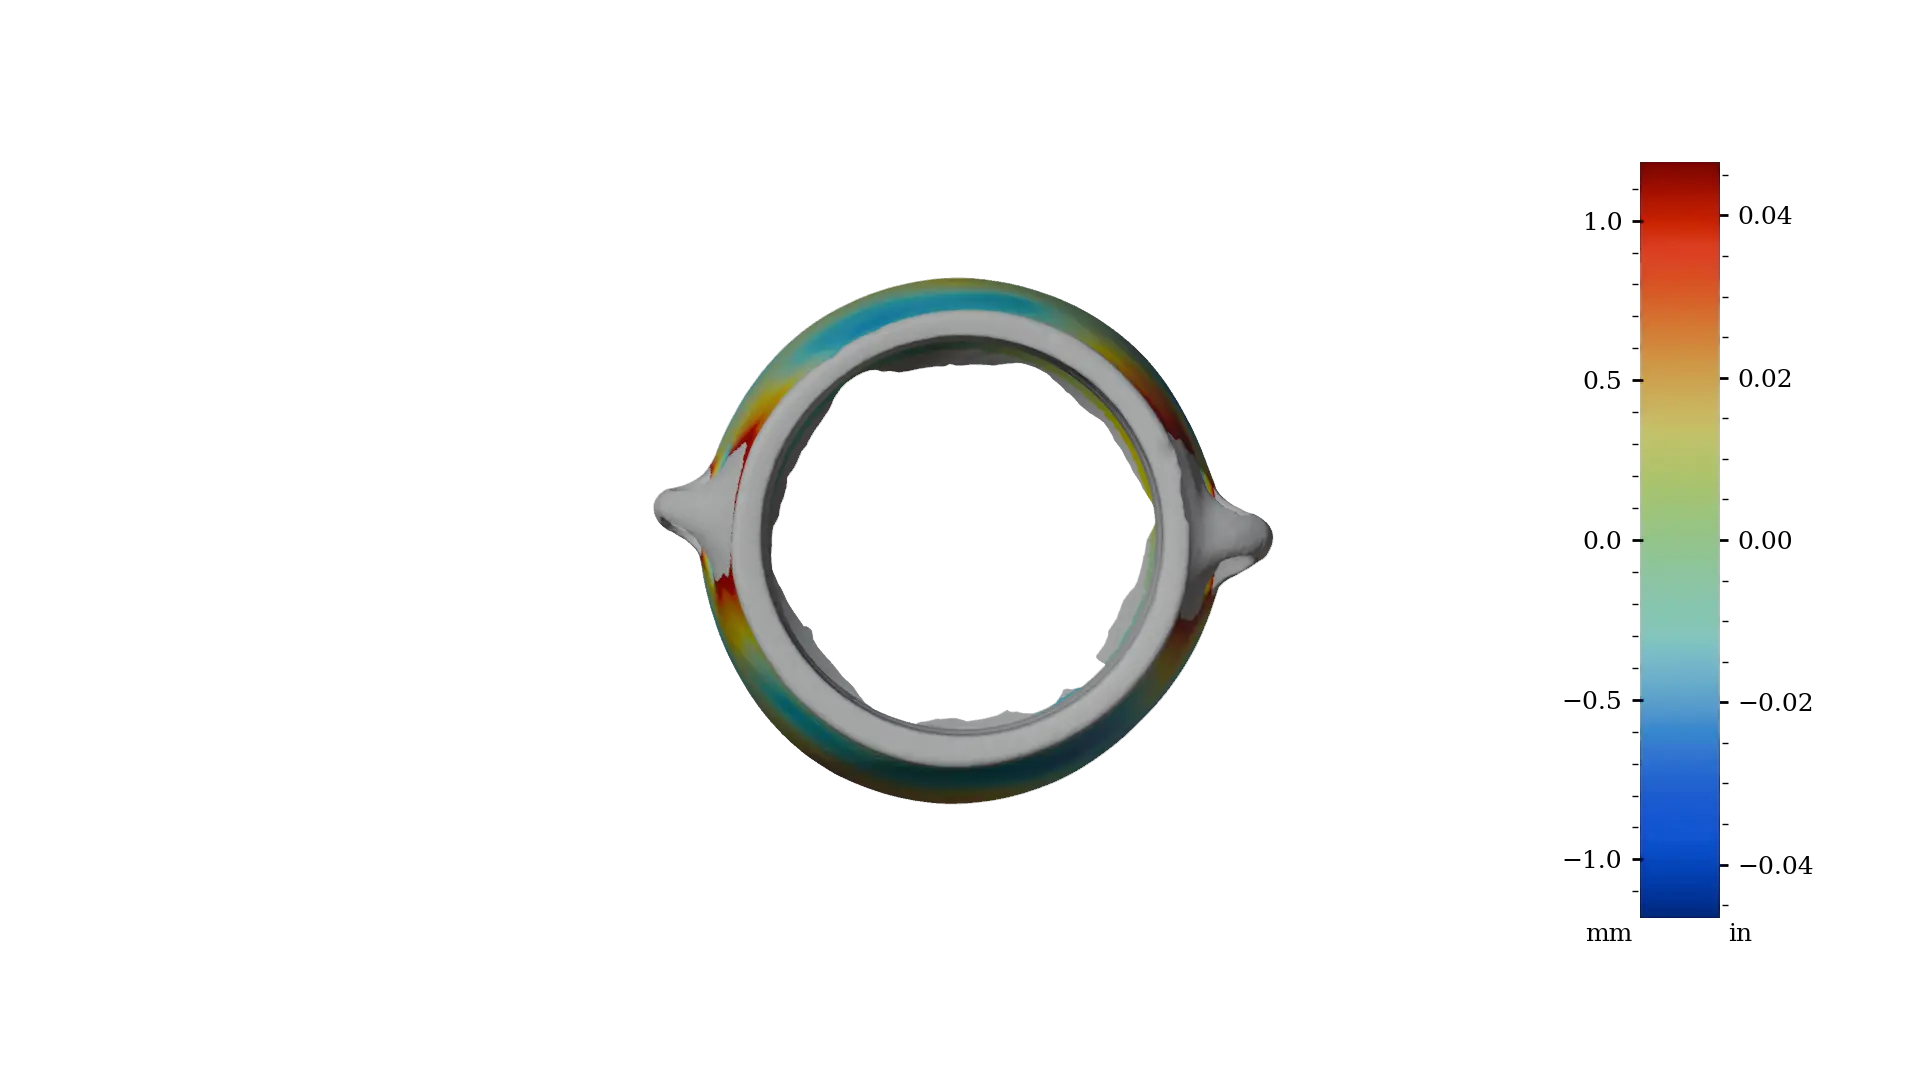
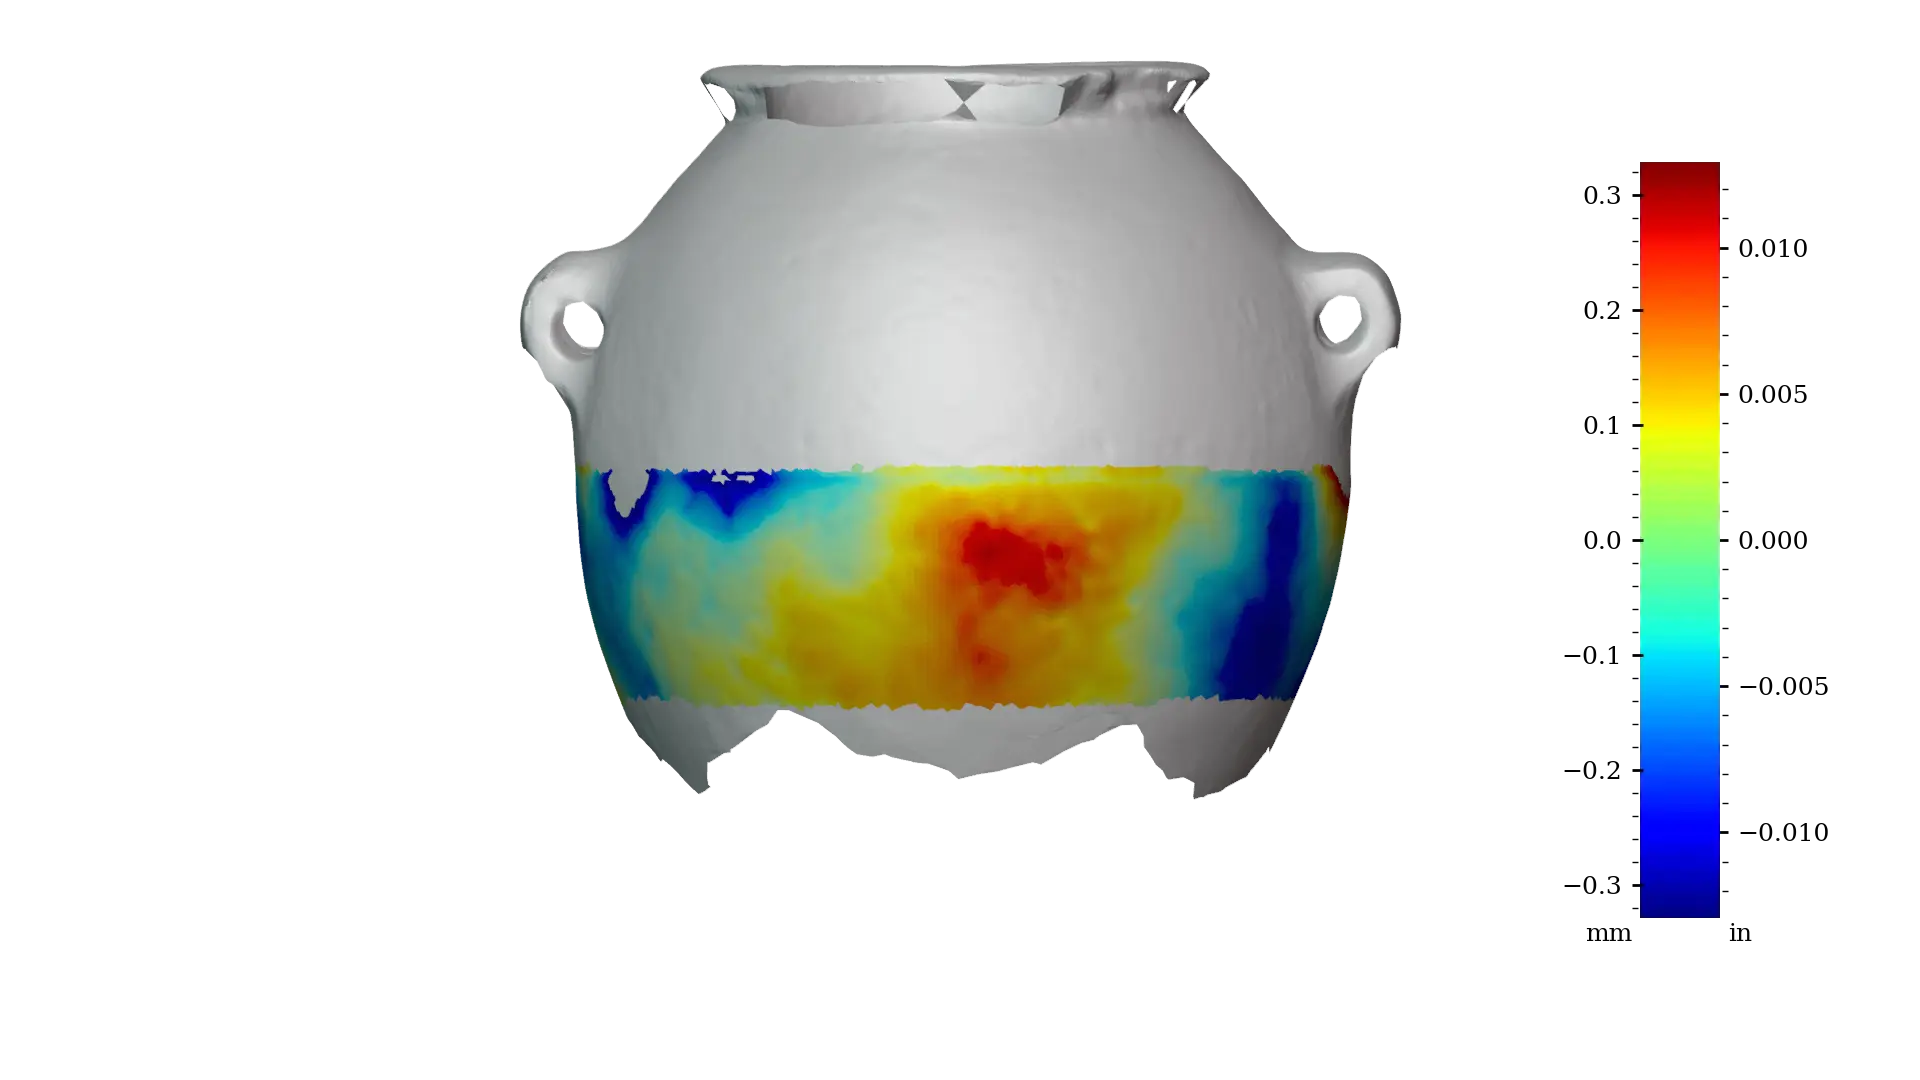 Figure 7 - MV003b exterior lower
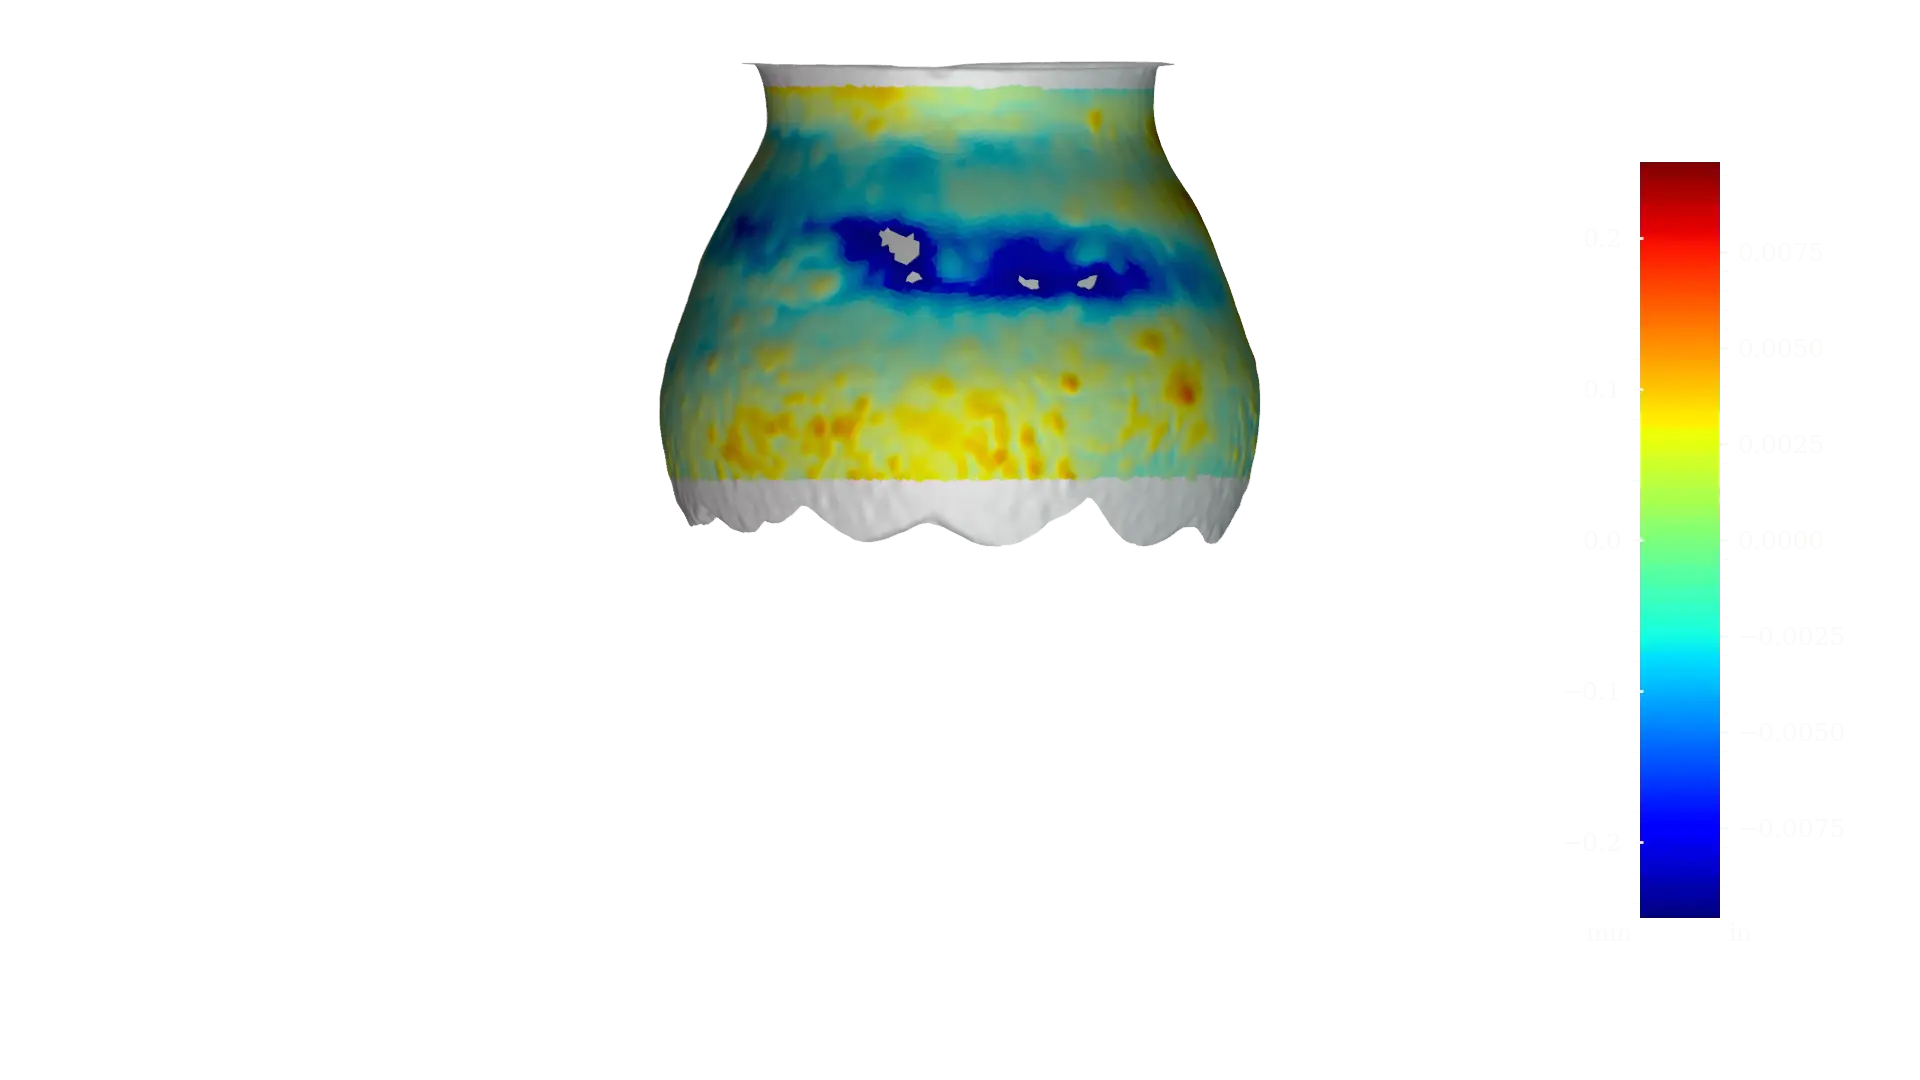
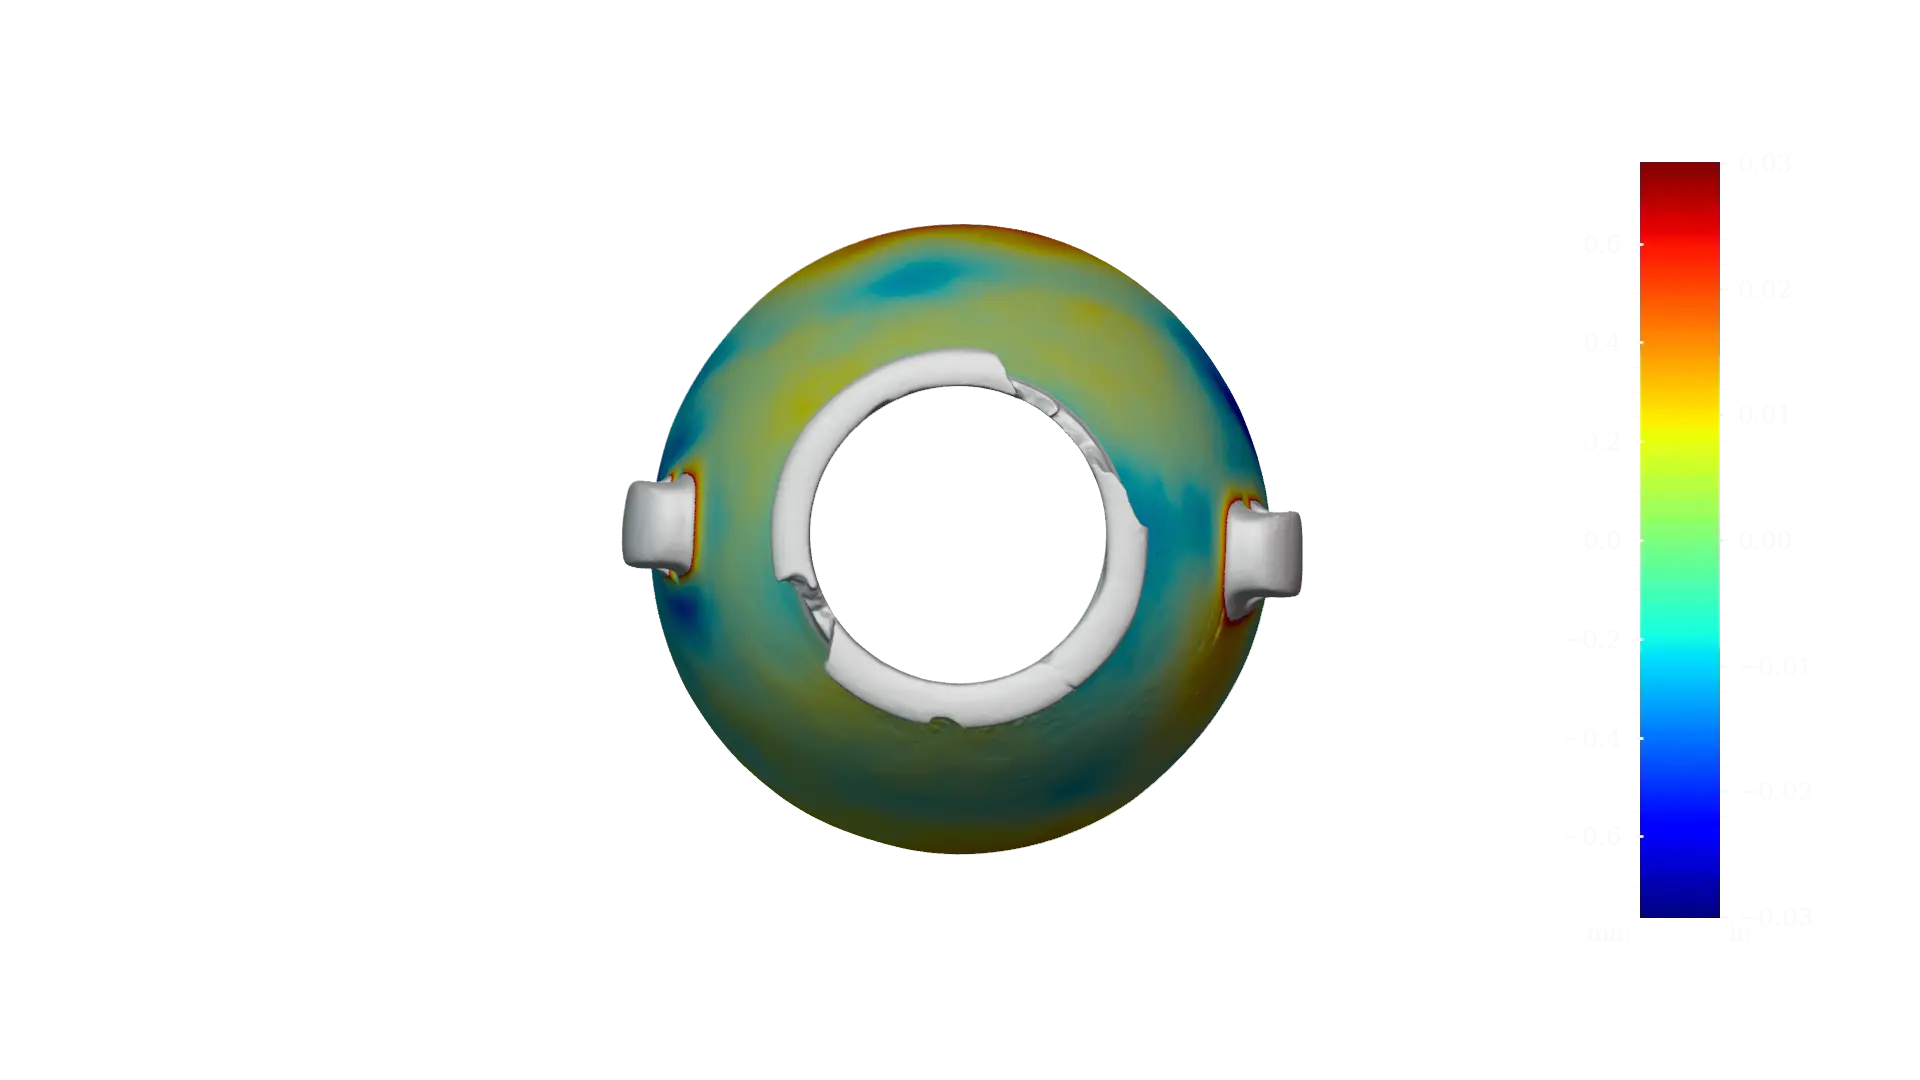
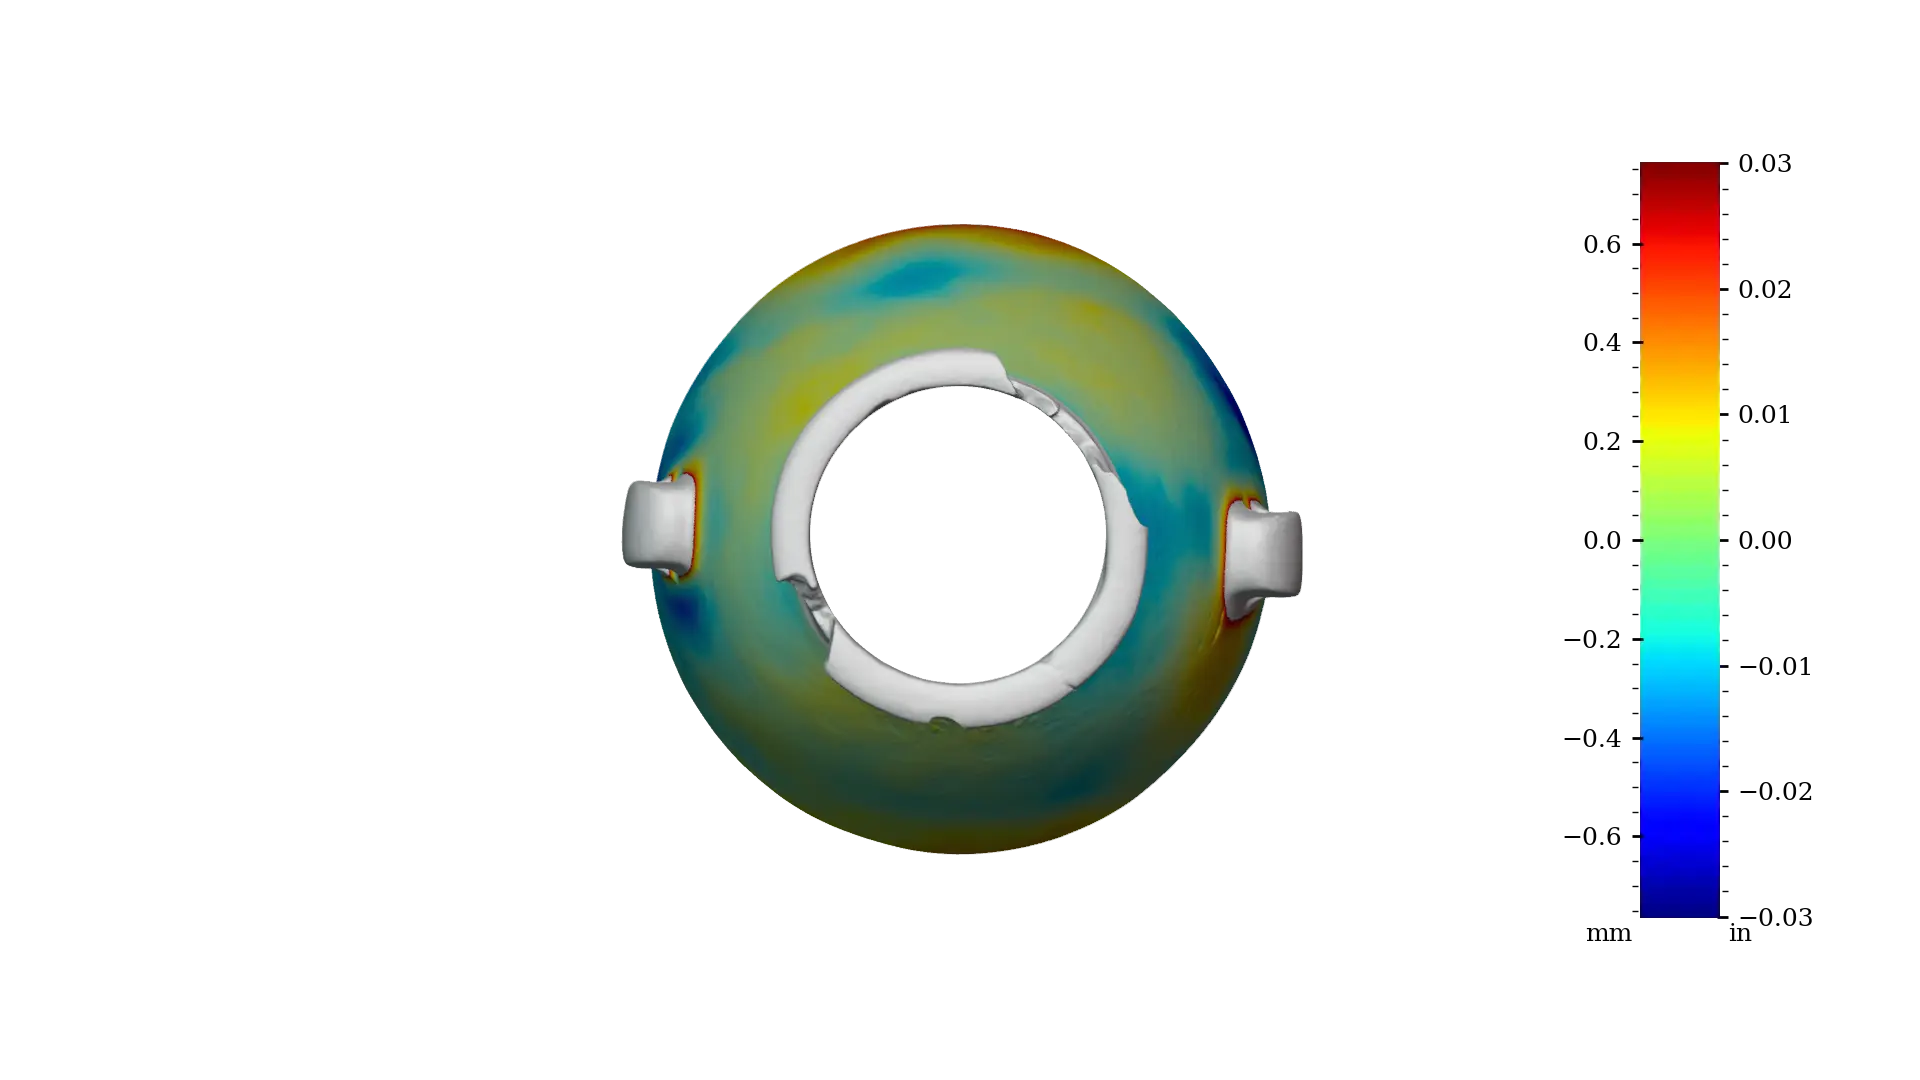
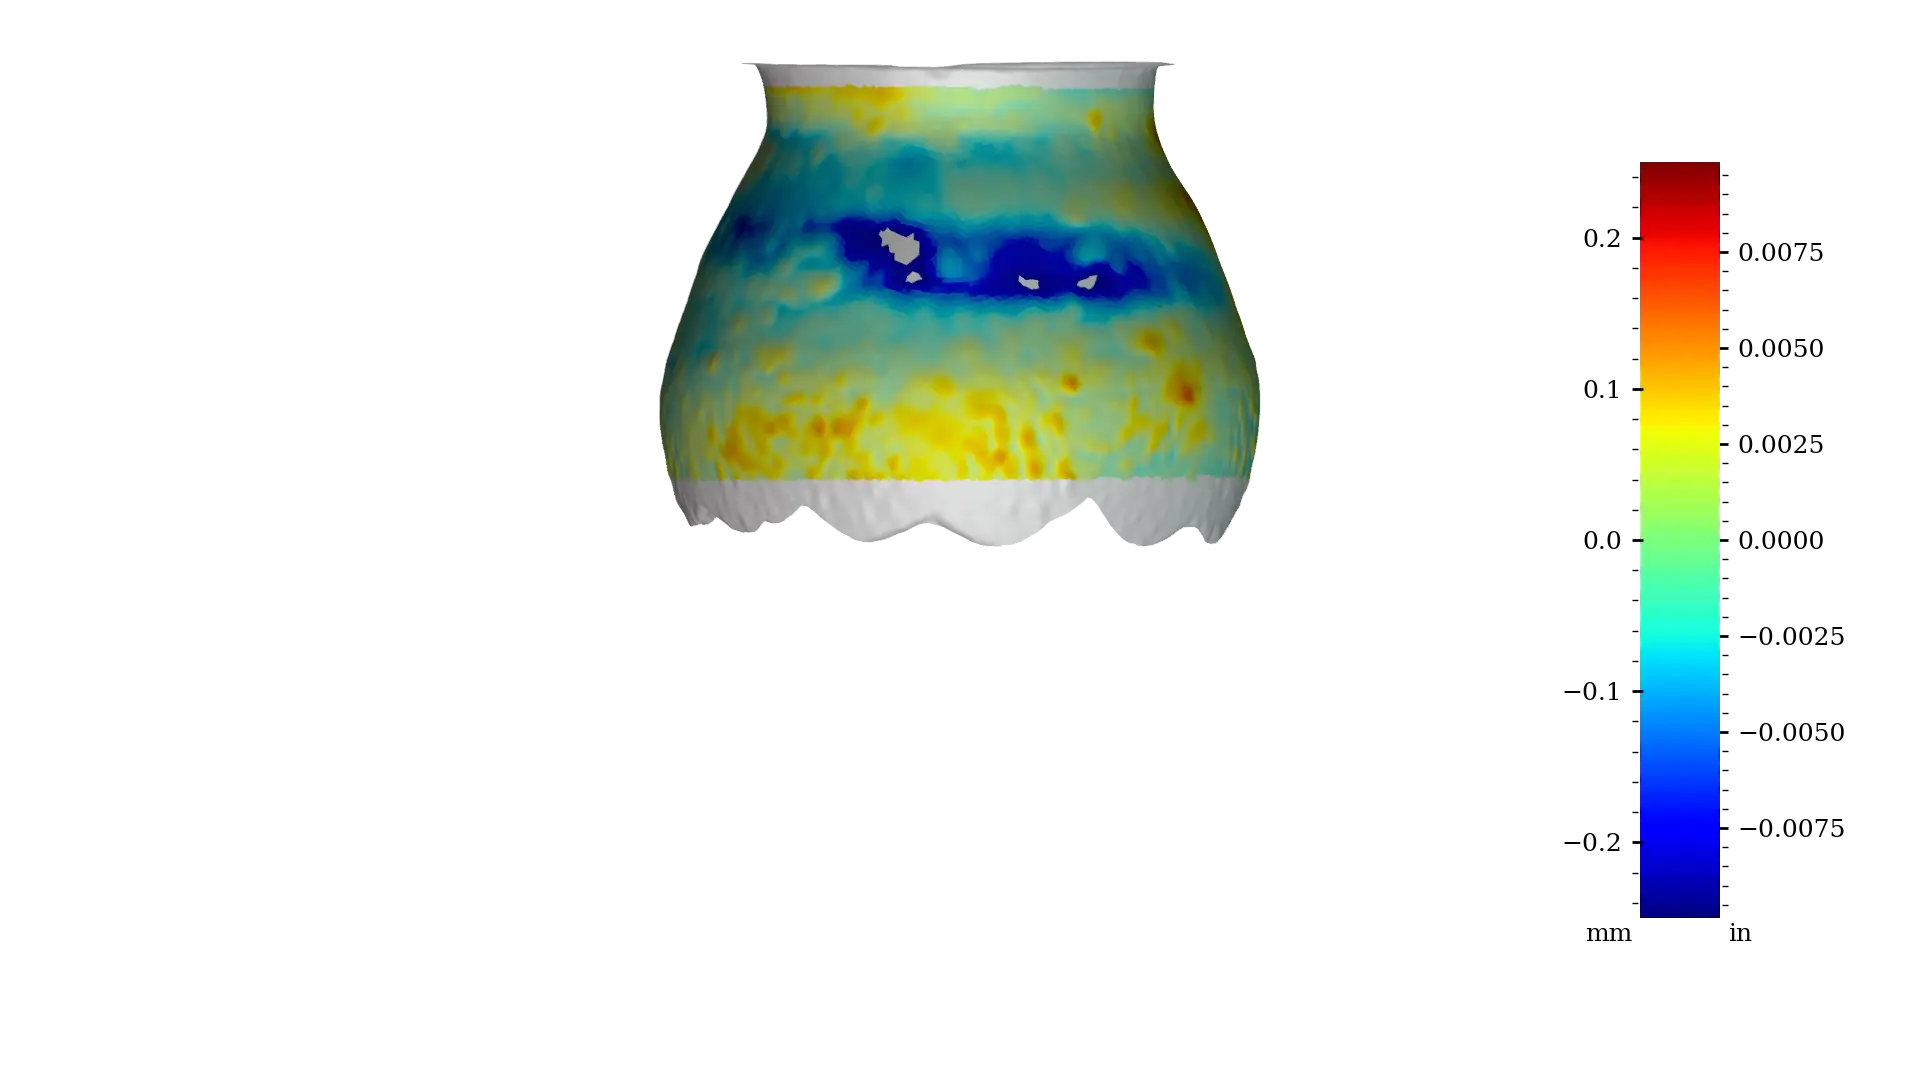 Figure 8 - MV003b interior full
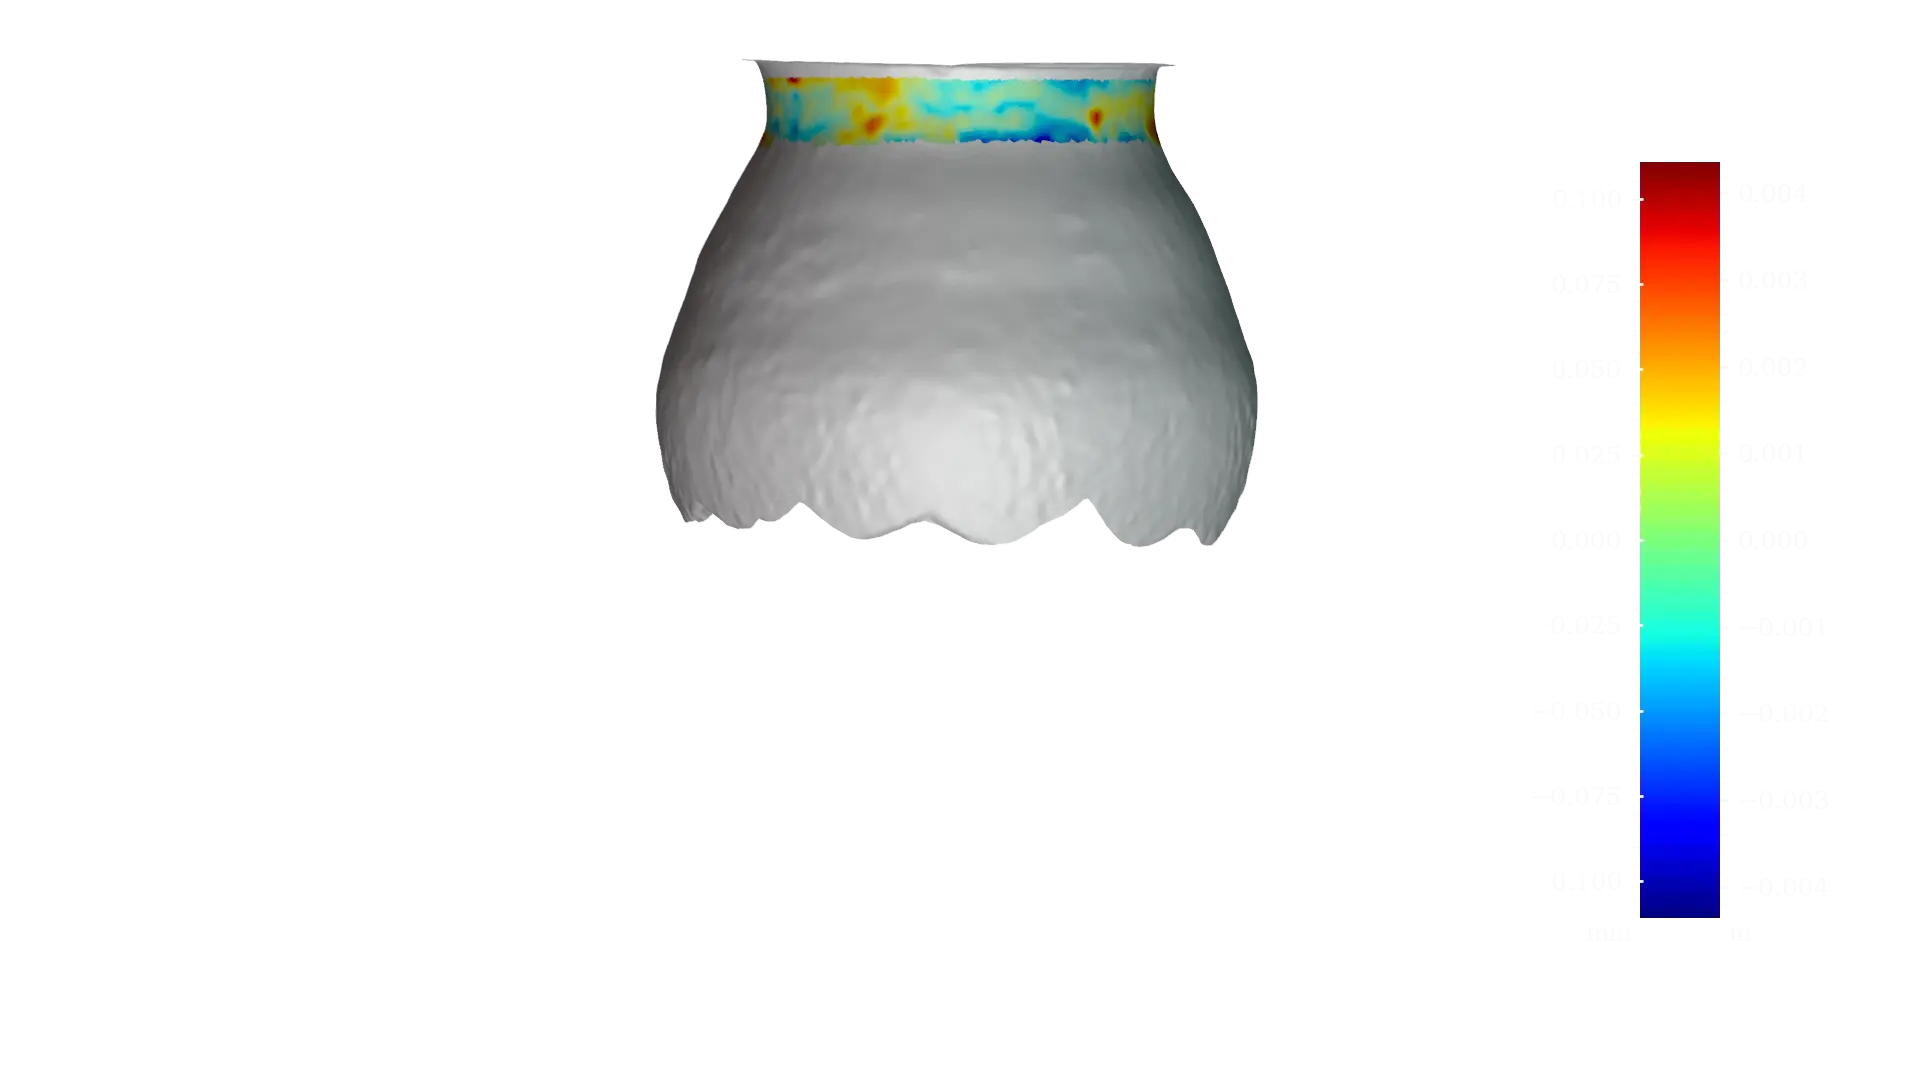
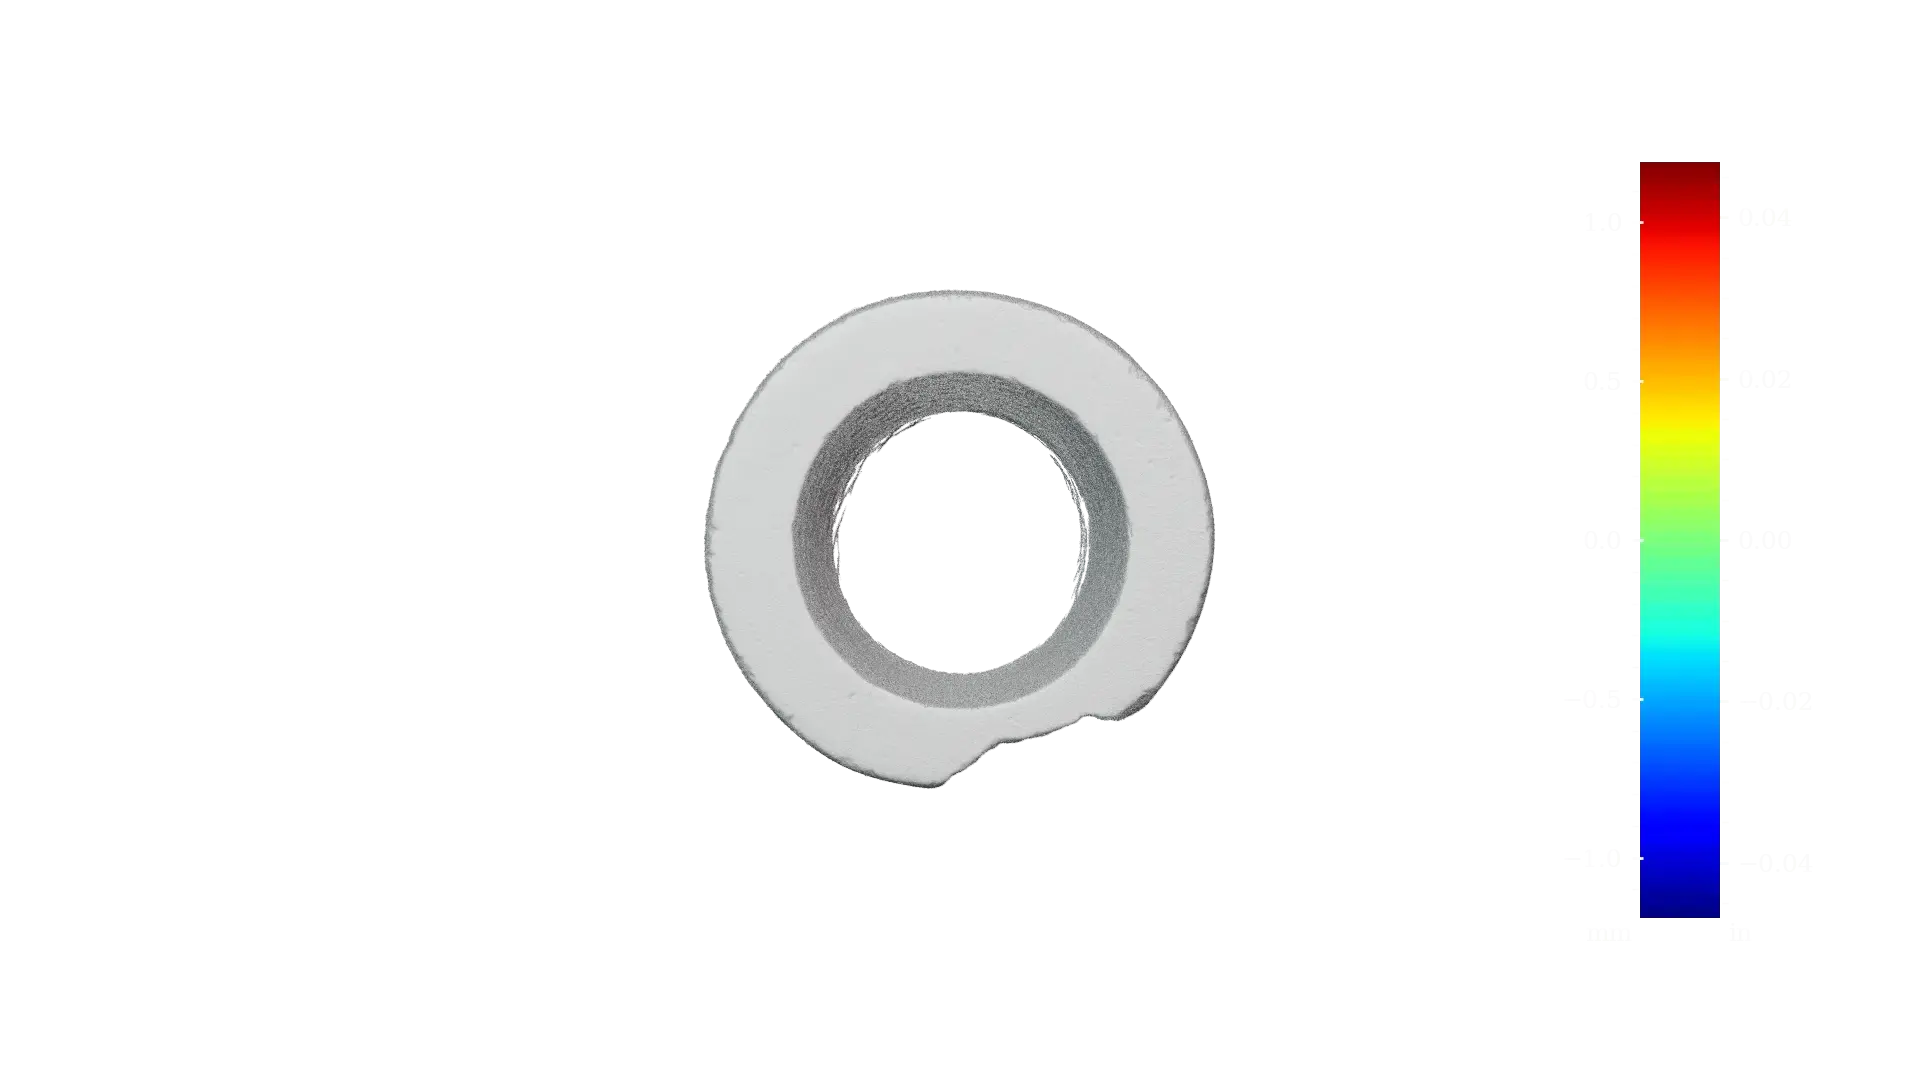
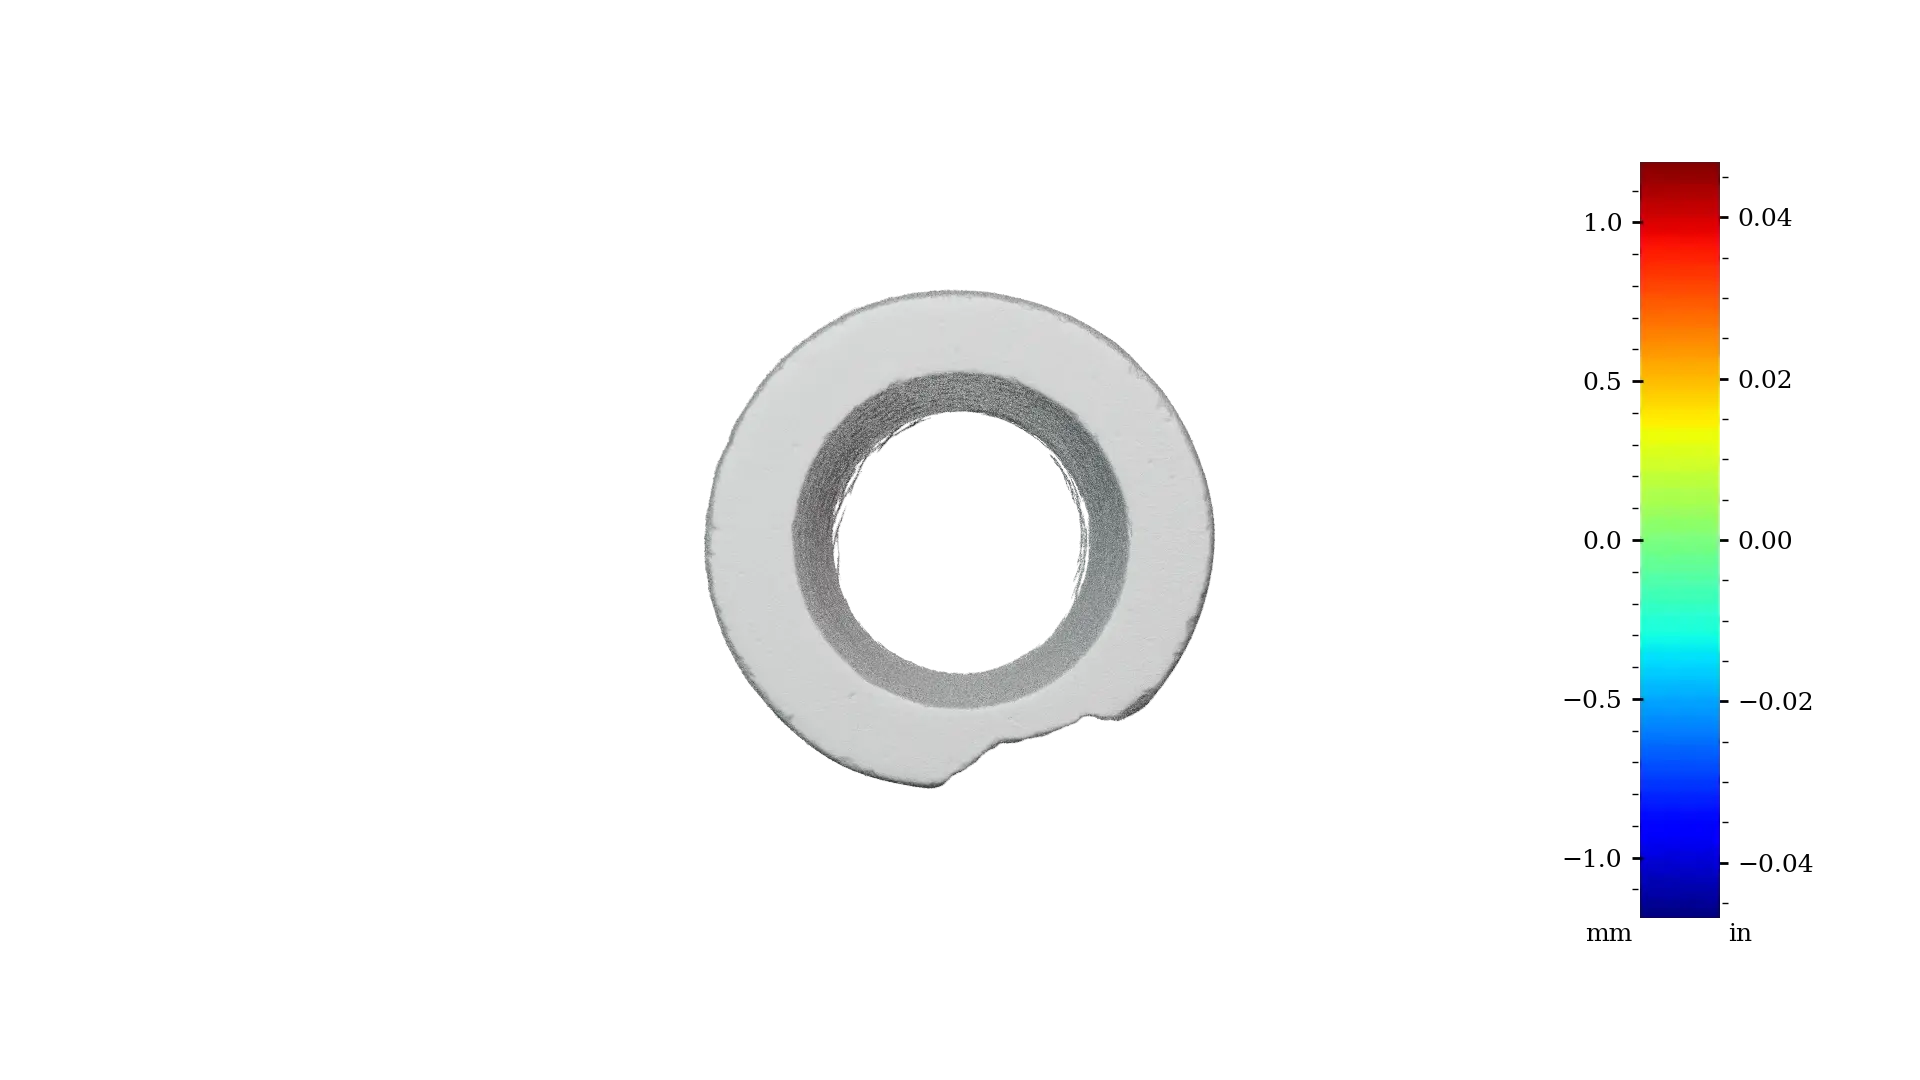
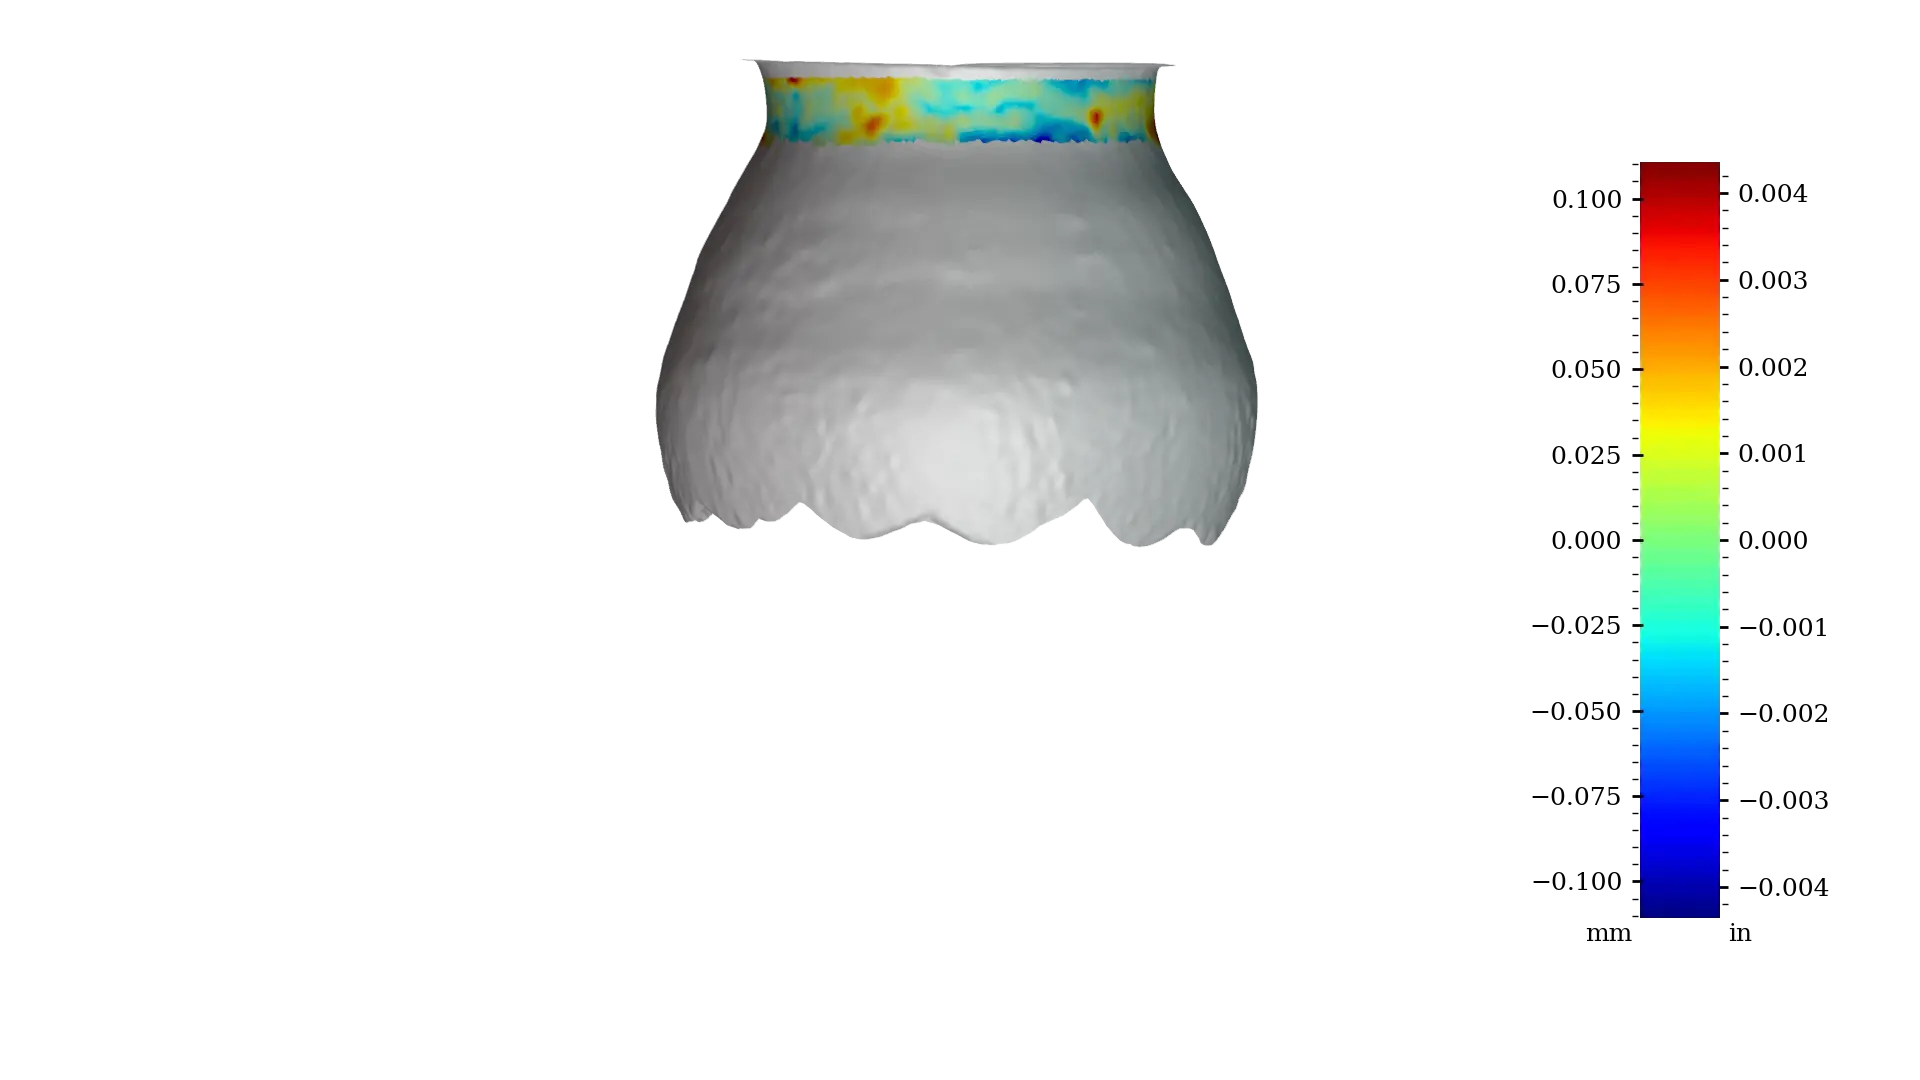 Figure 9 - MV003b interior opening
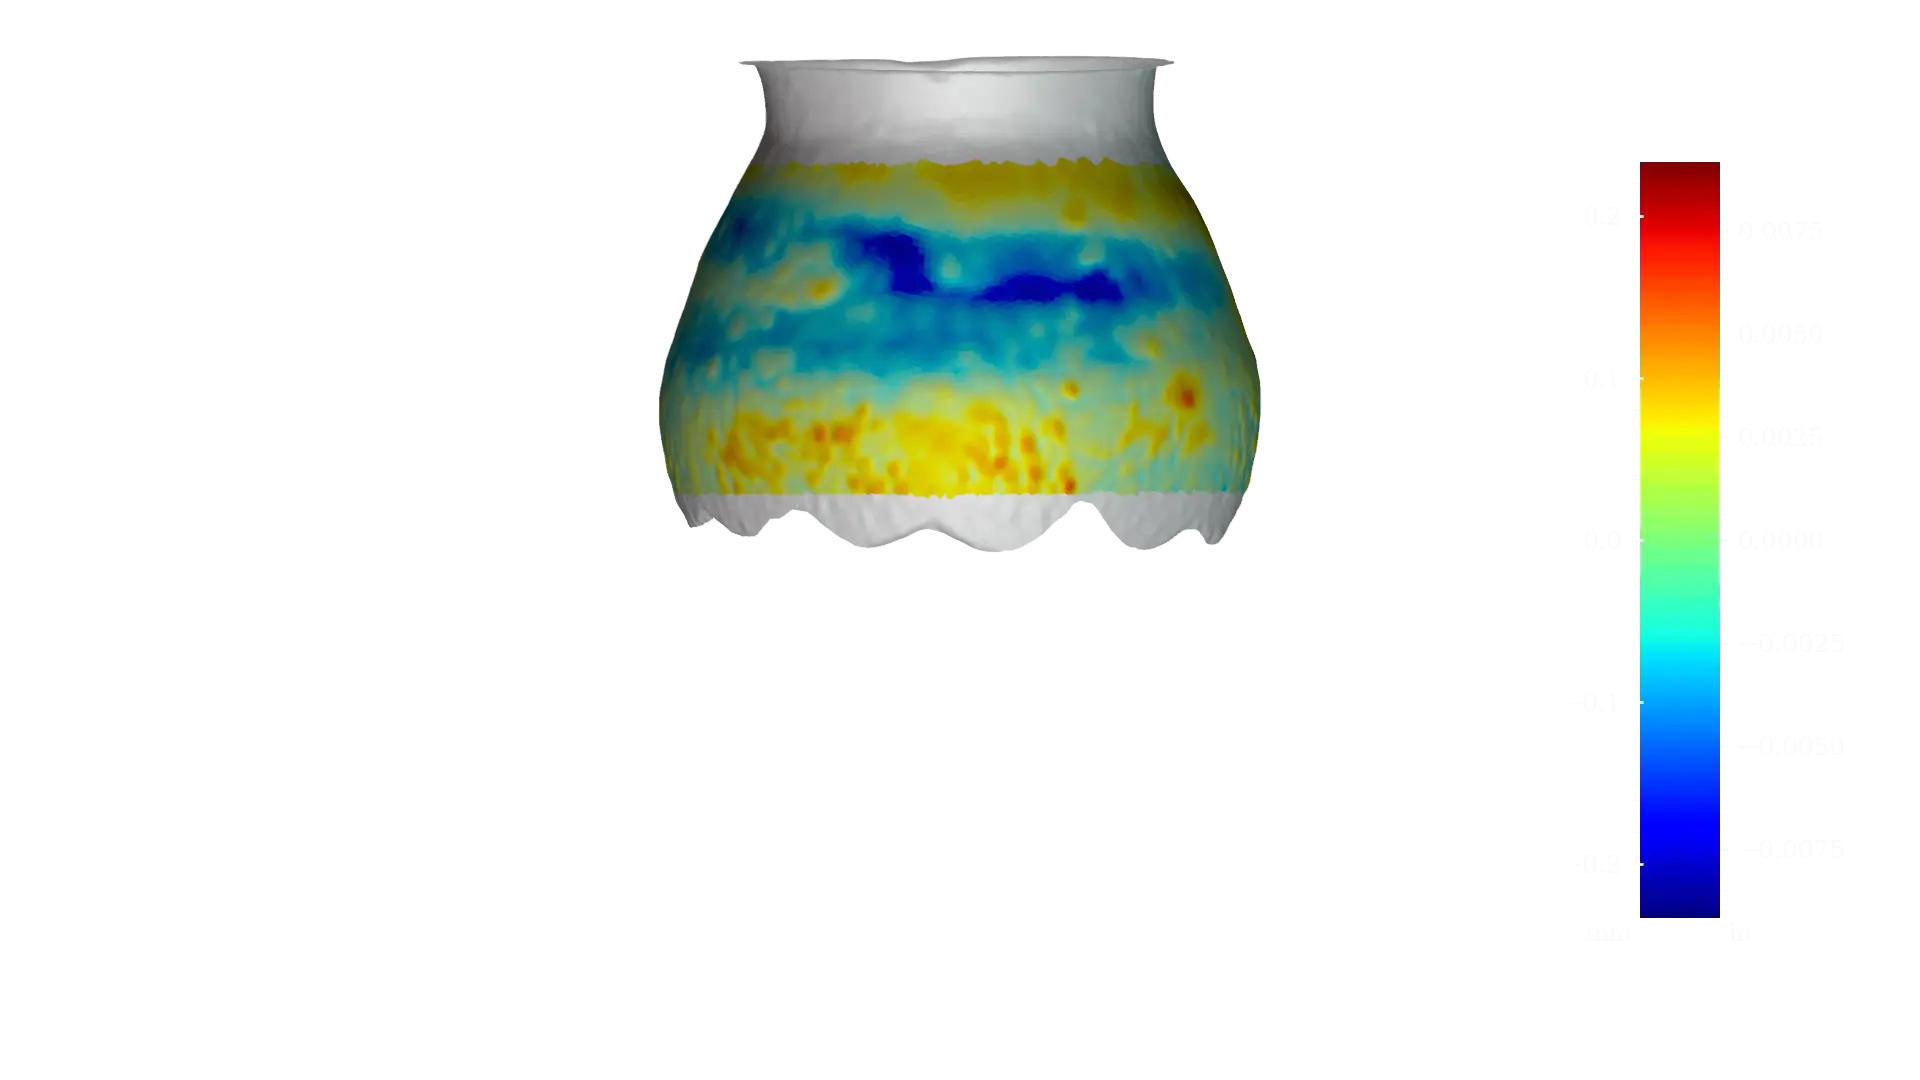
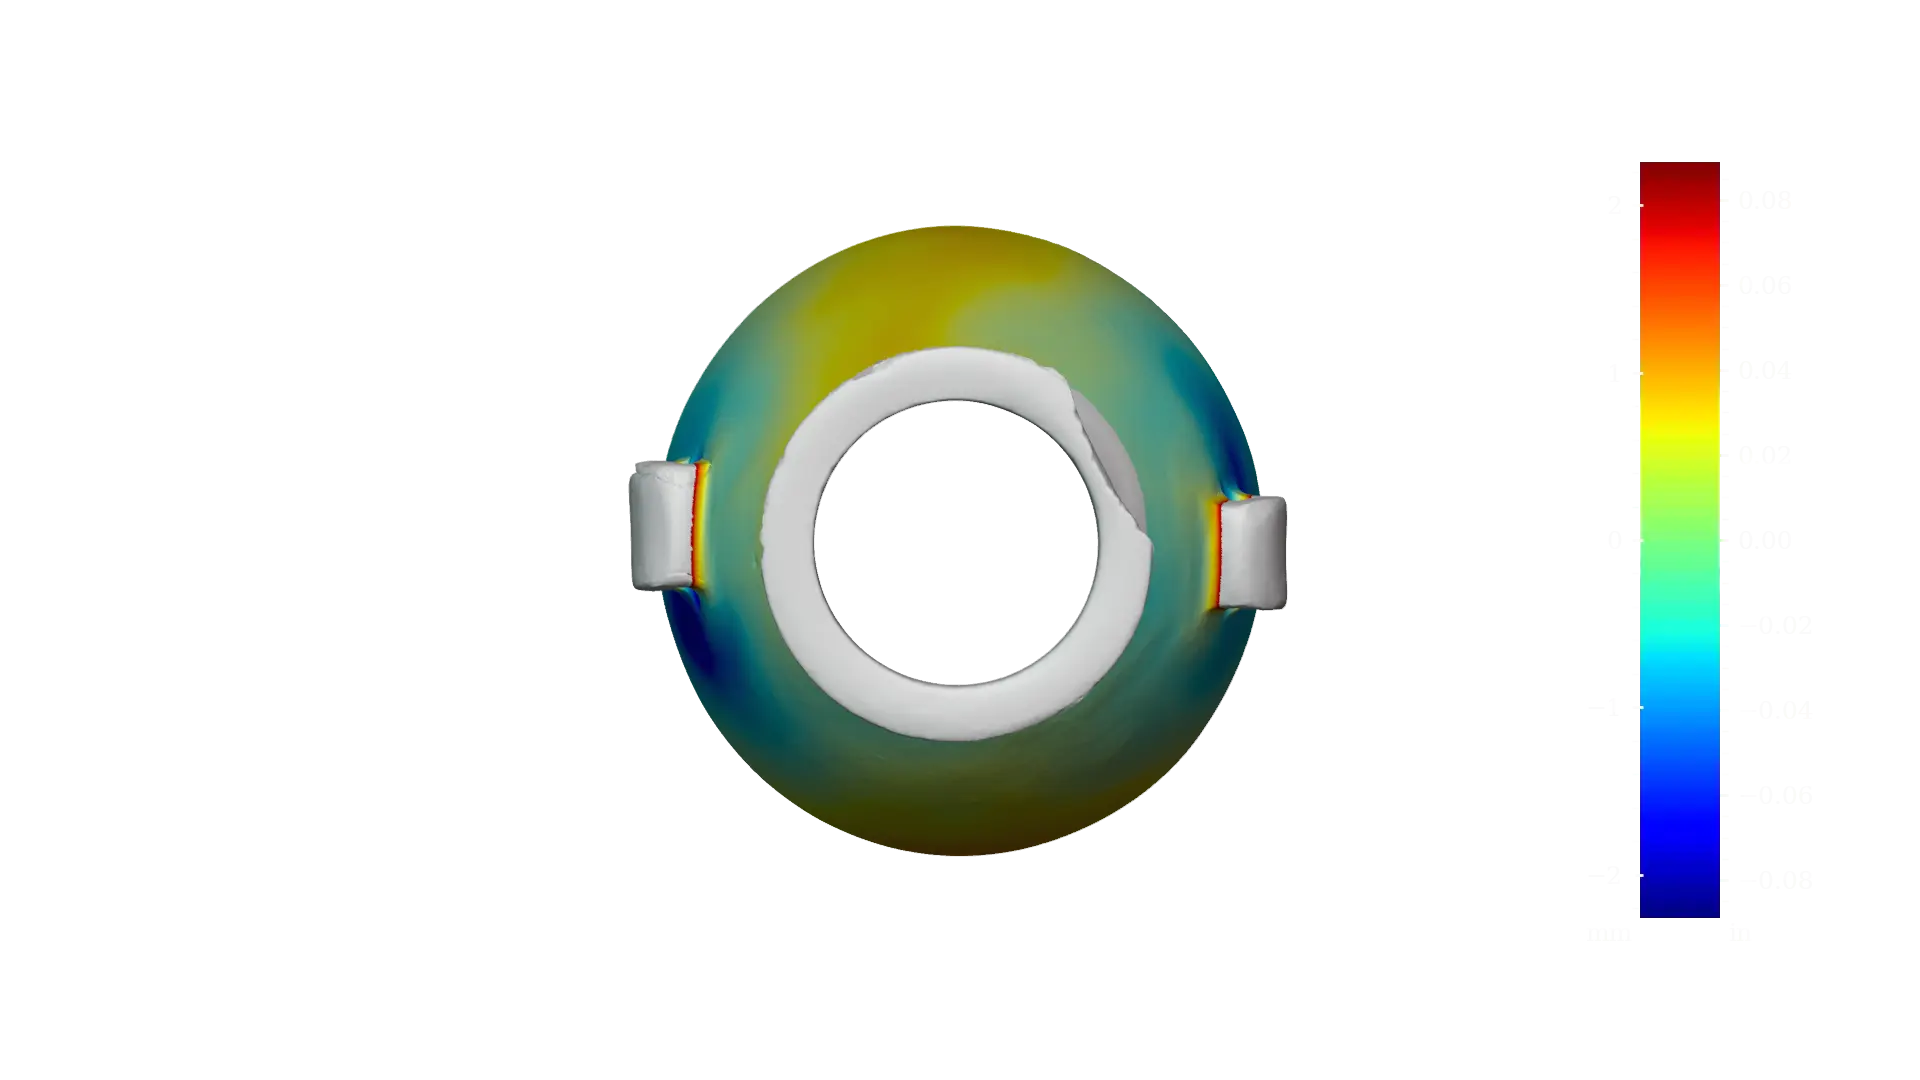
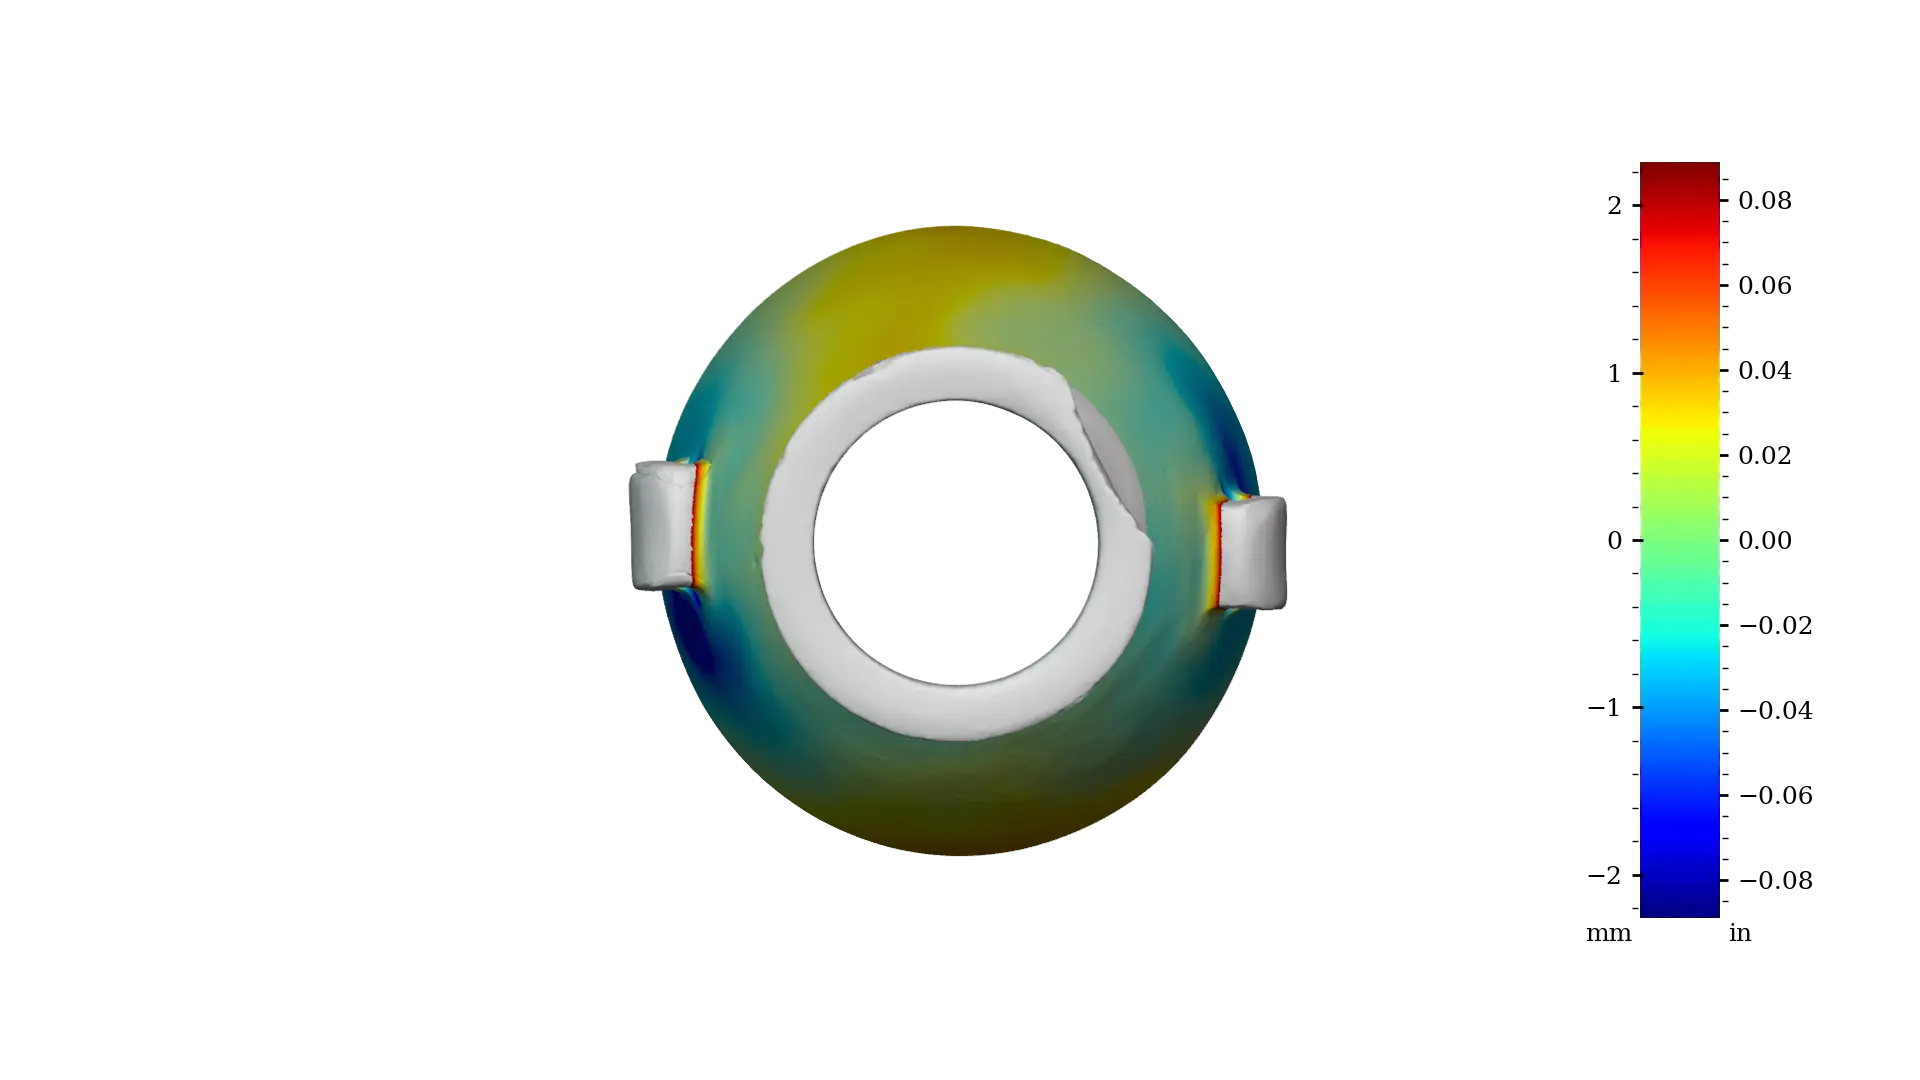
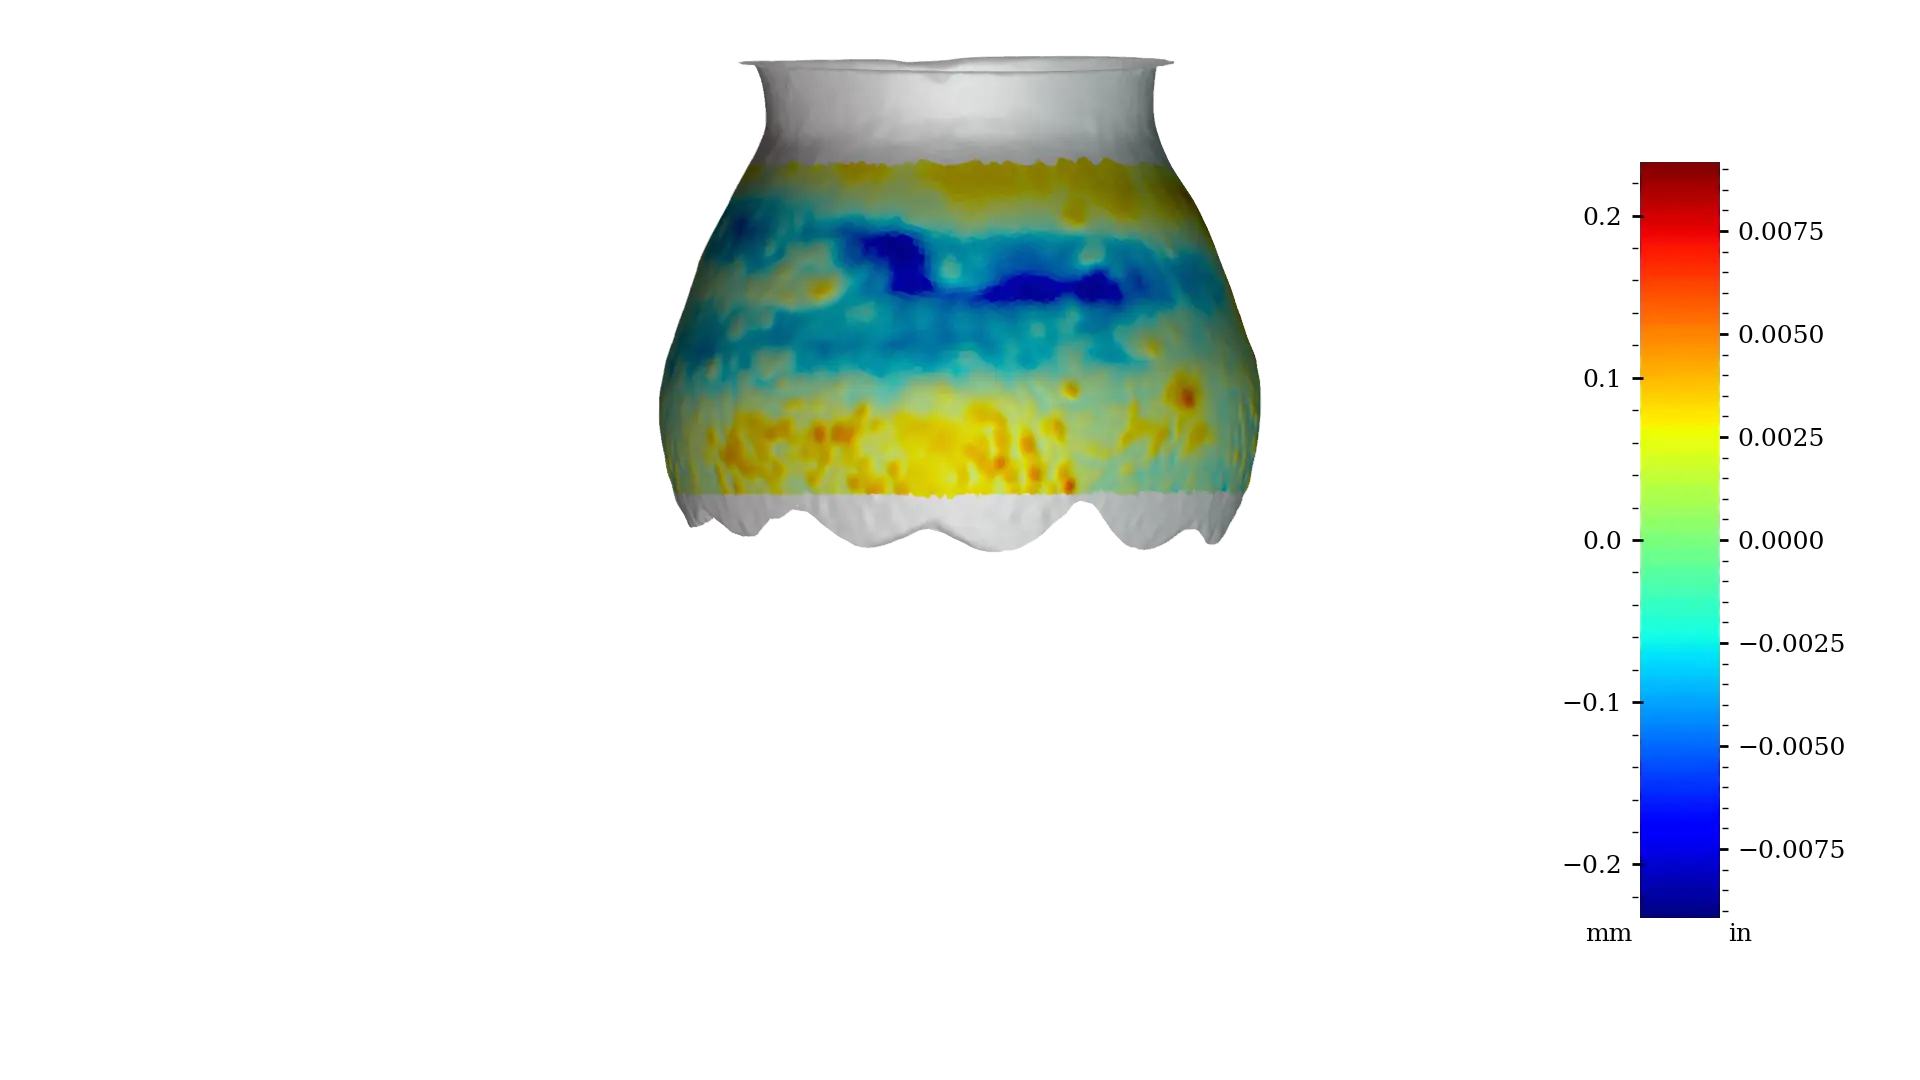 Figure 10 - MV003b interior cavity
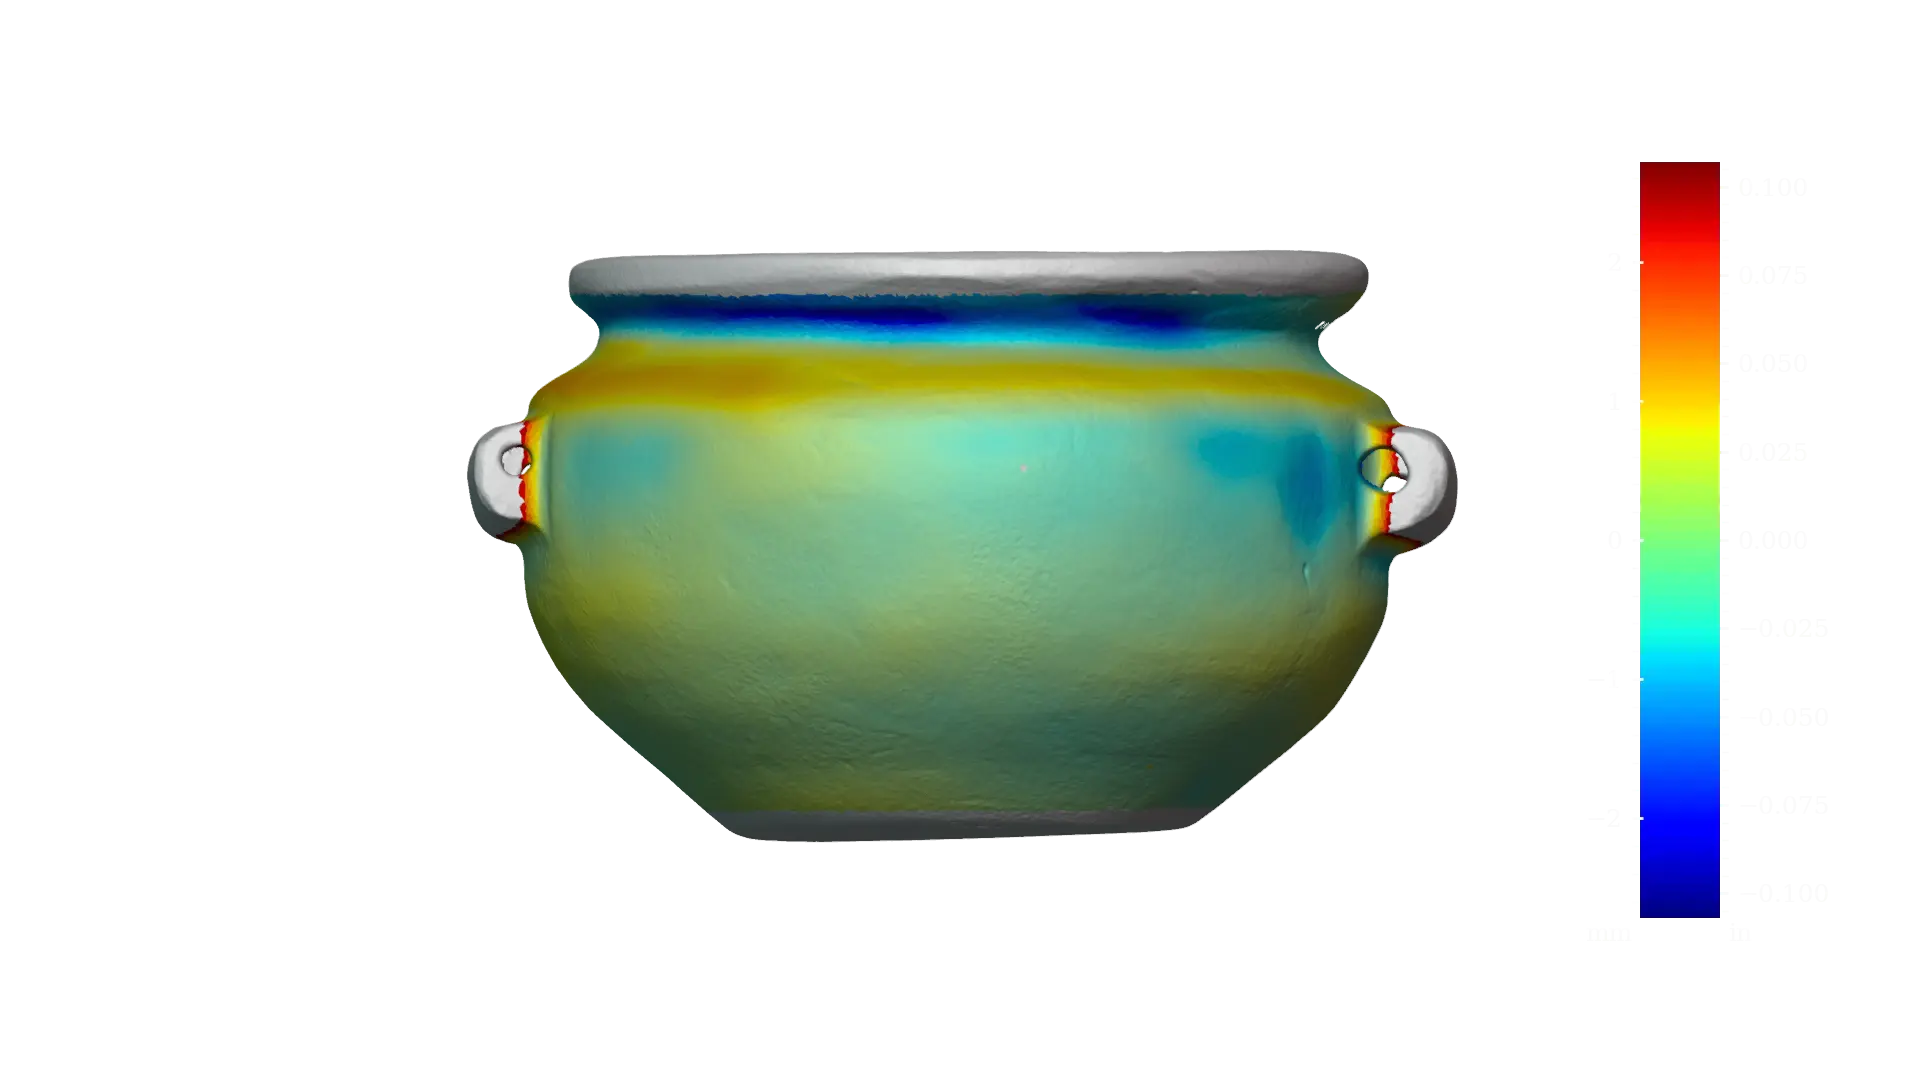
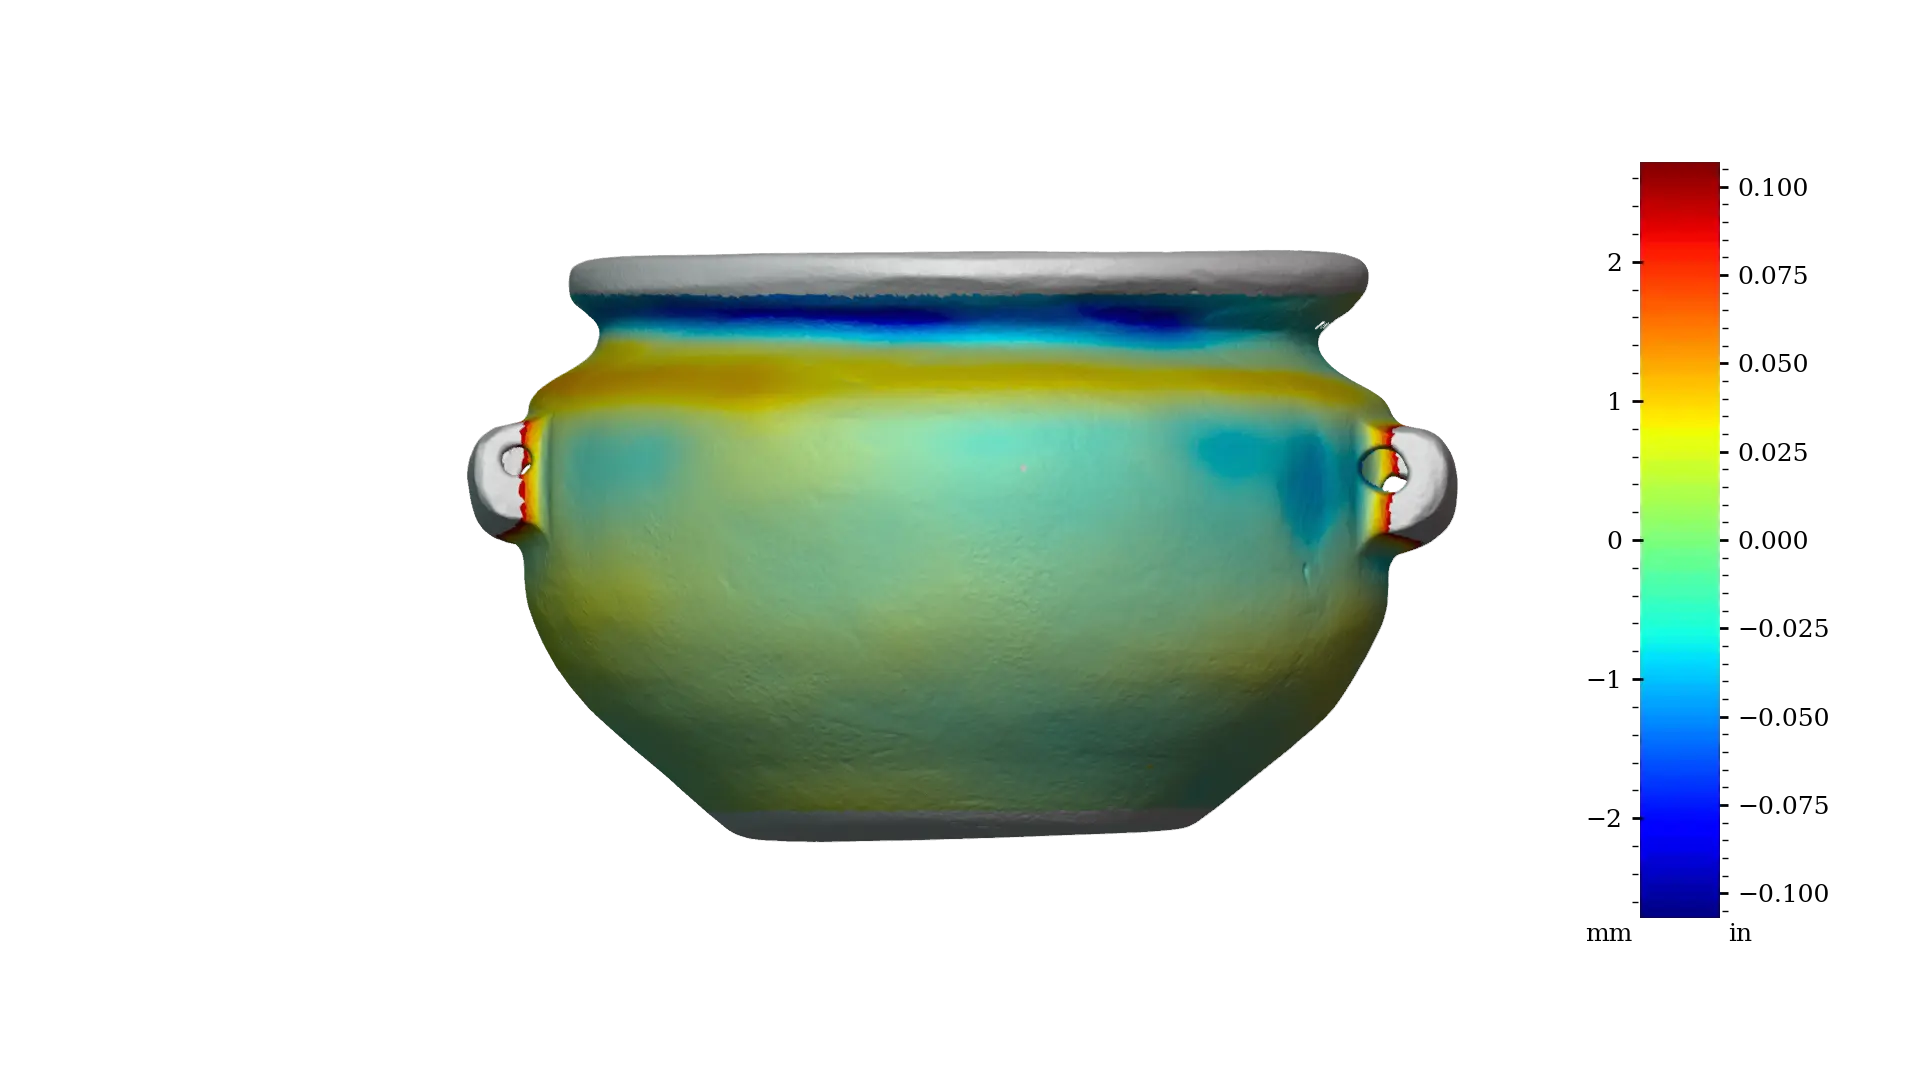 Figure 11 - RV003 exterior full
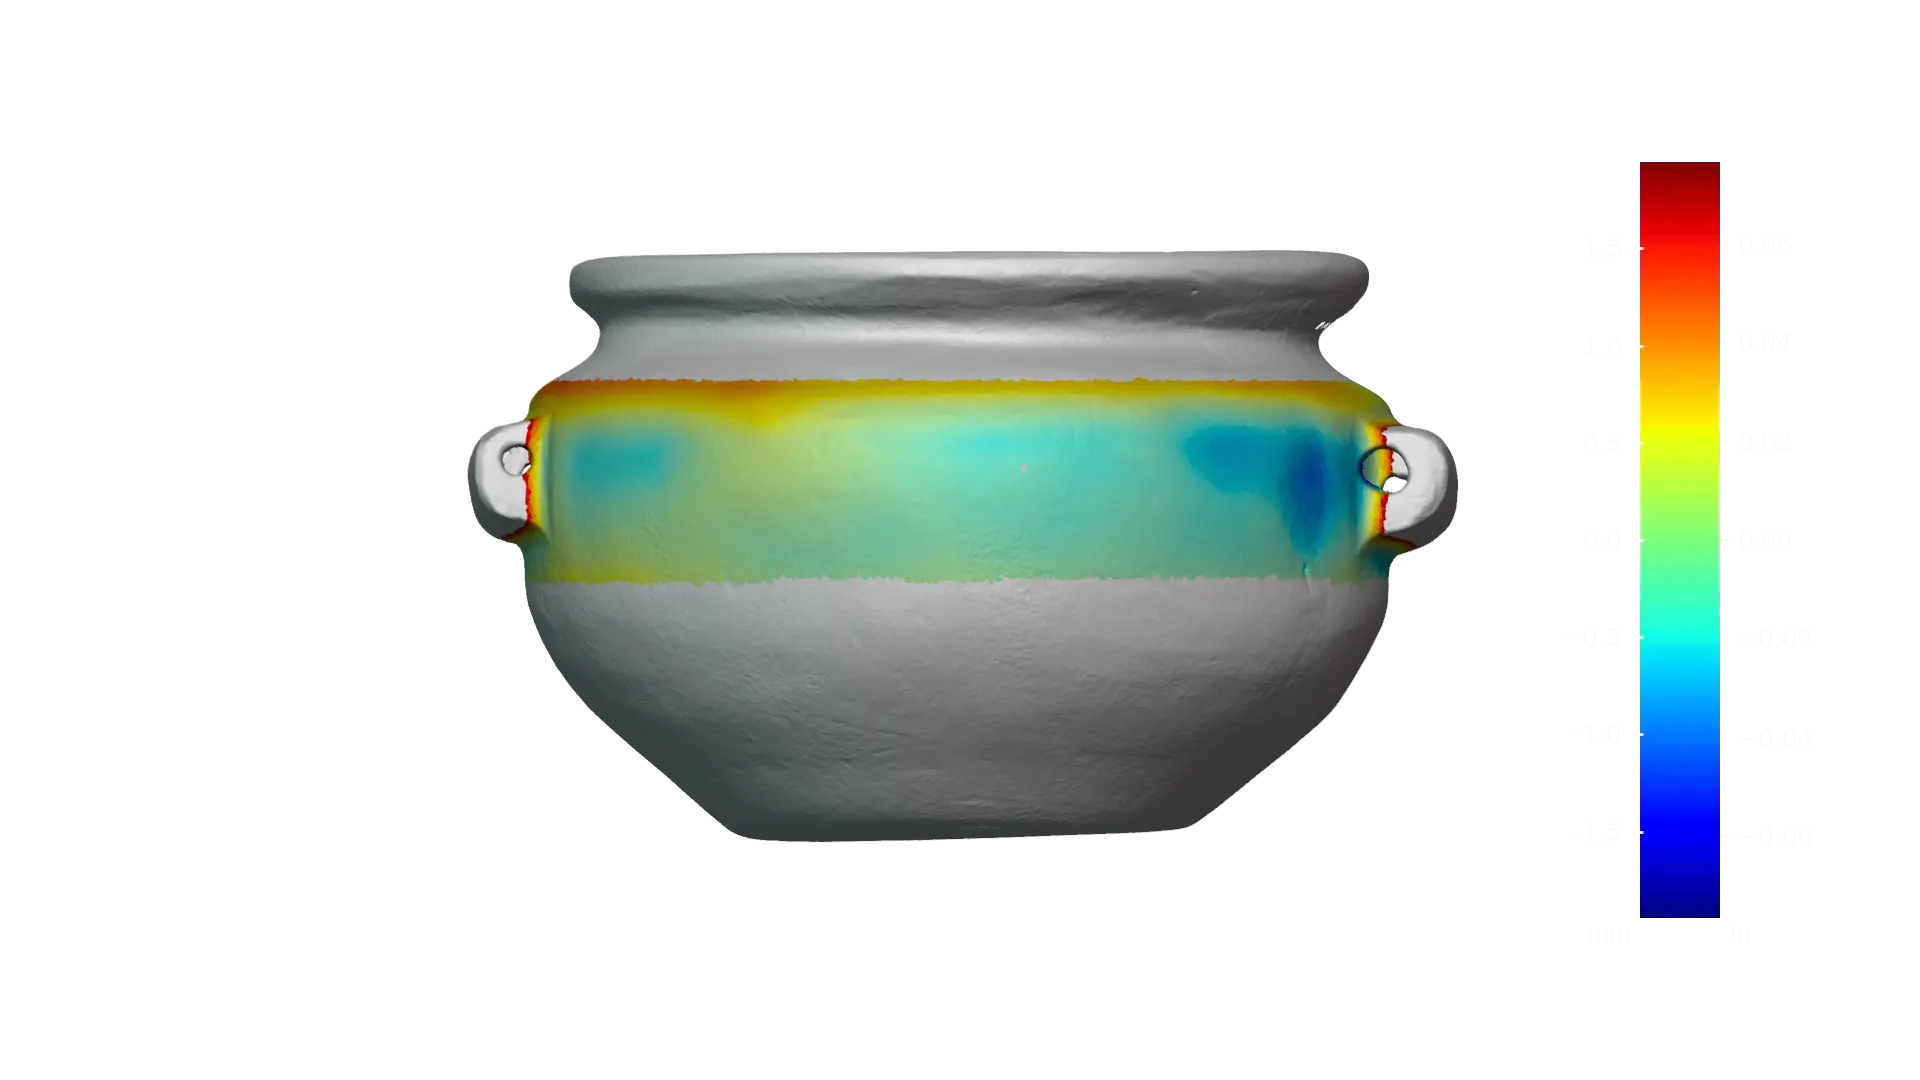
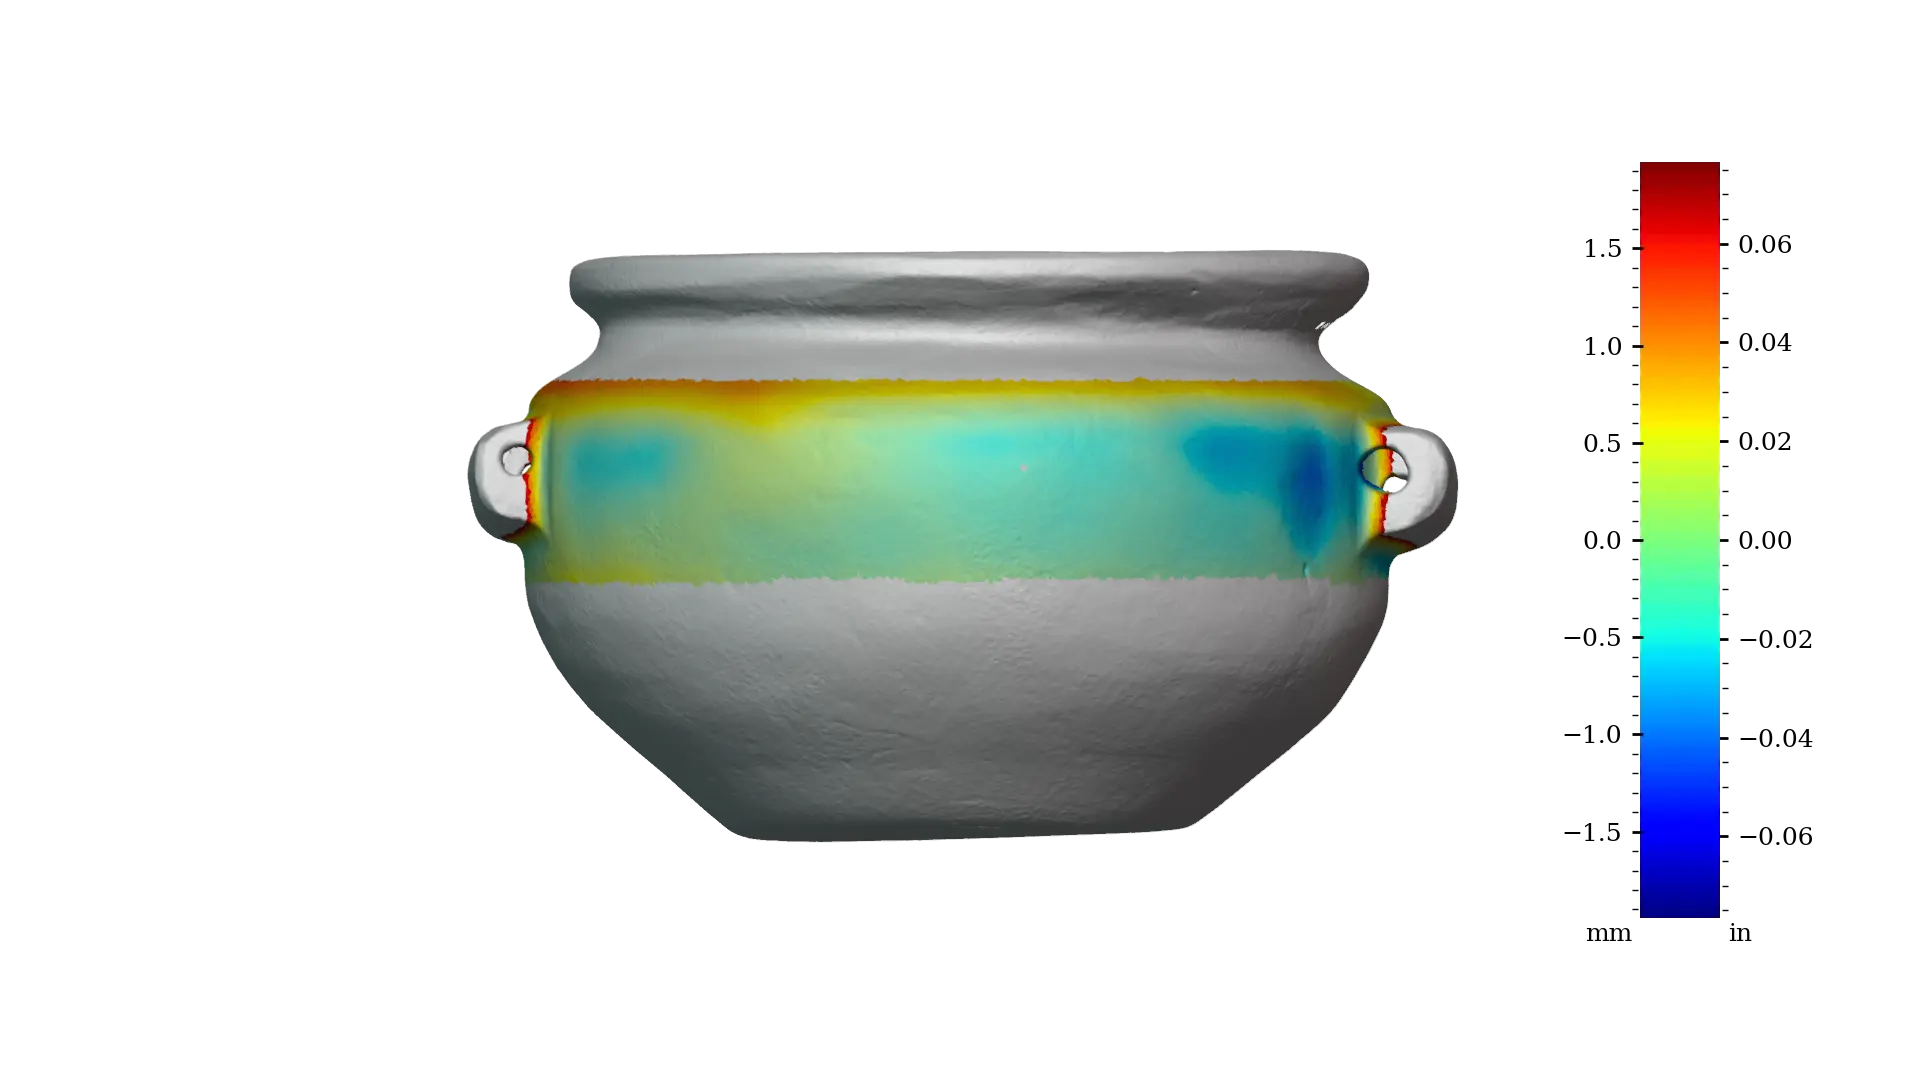 Figure 12 - RV003 exterior upper
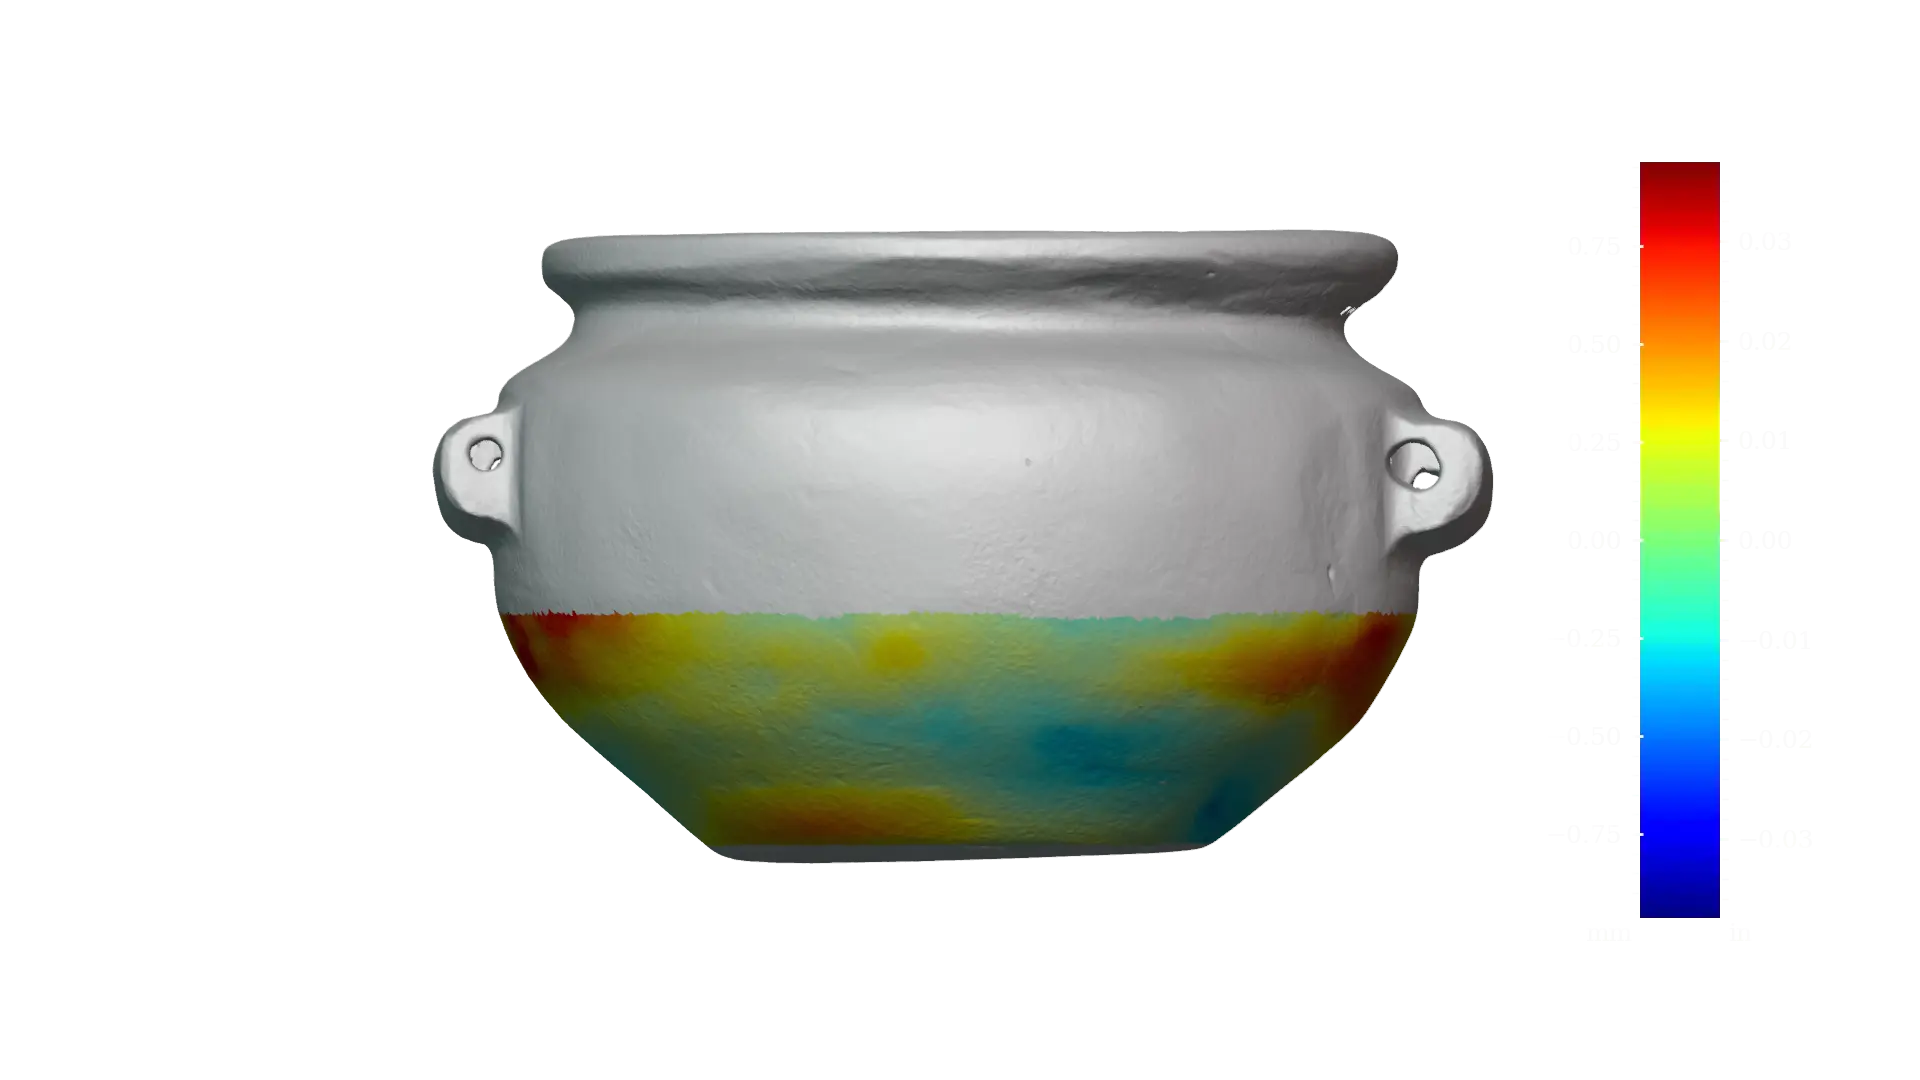
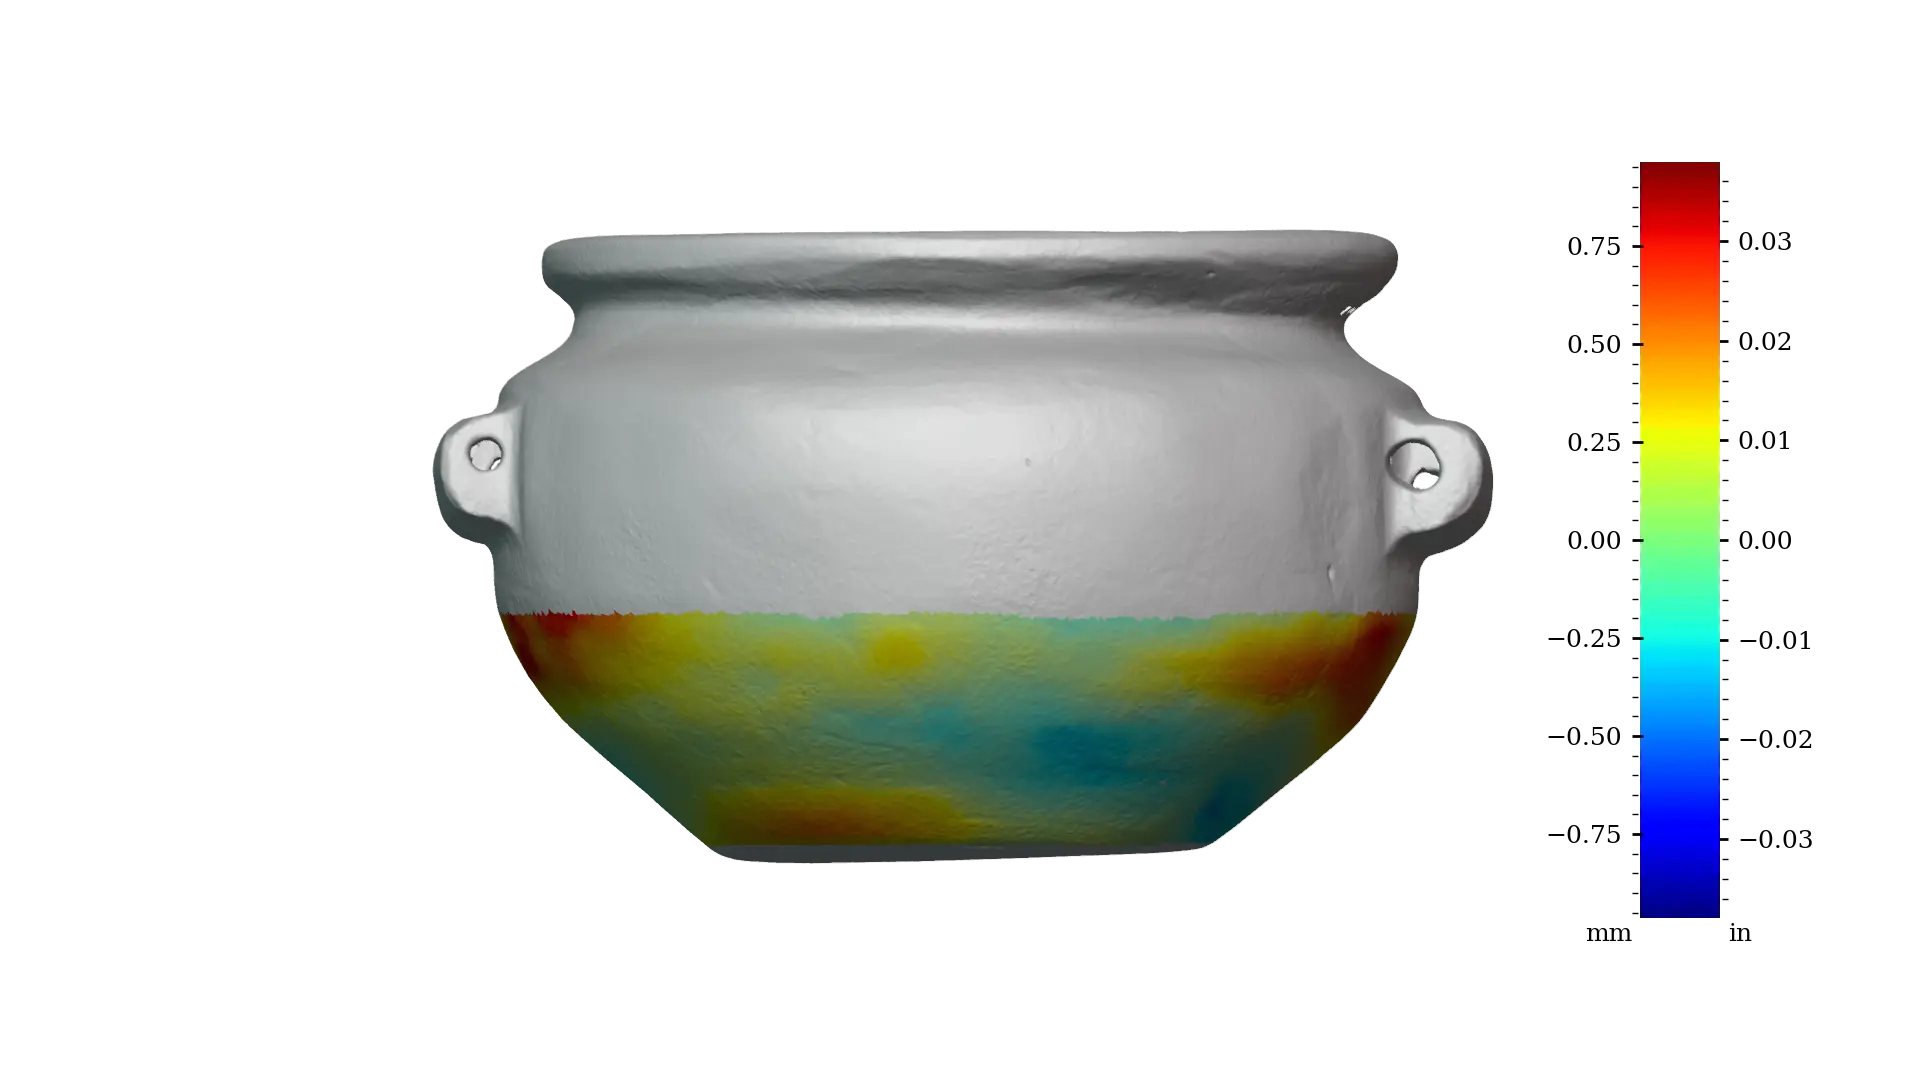 Figure 13 - RV003 exterior lower
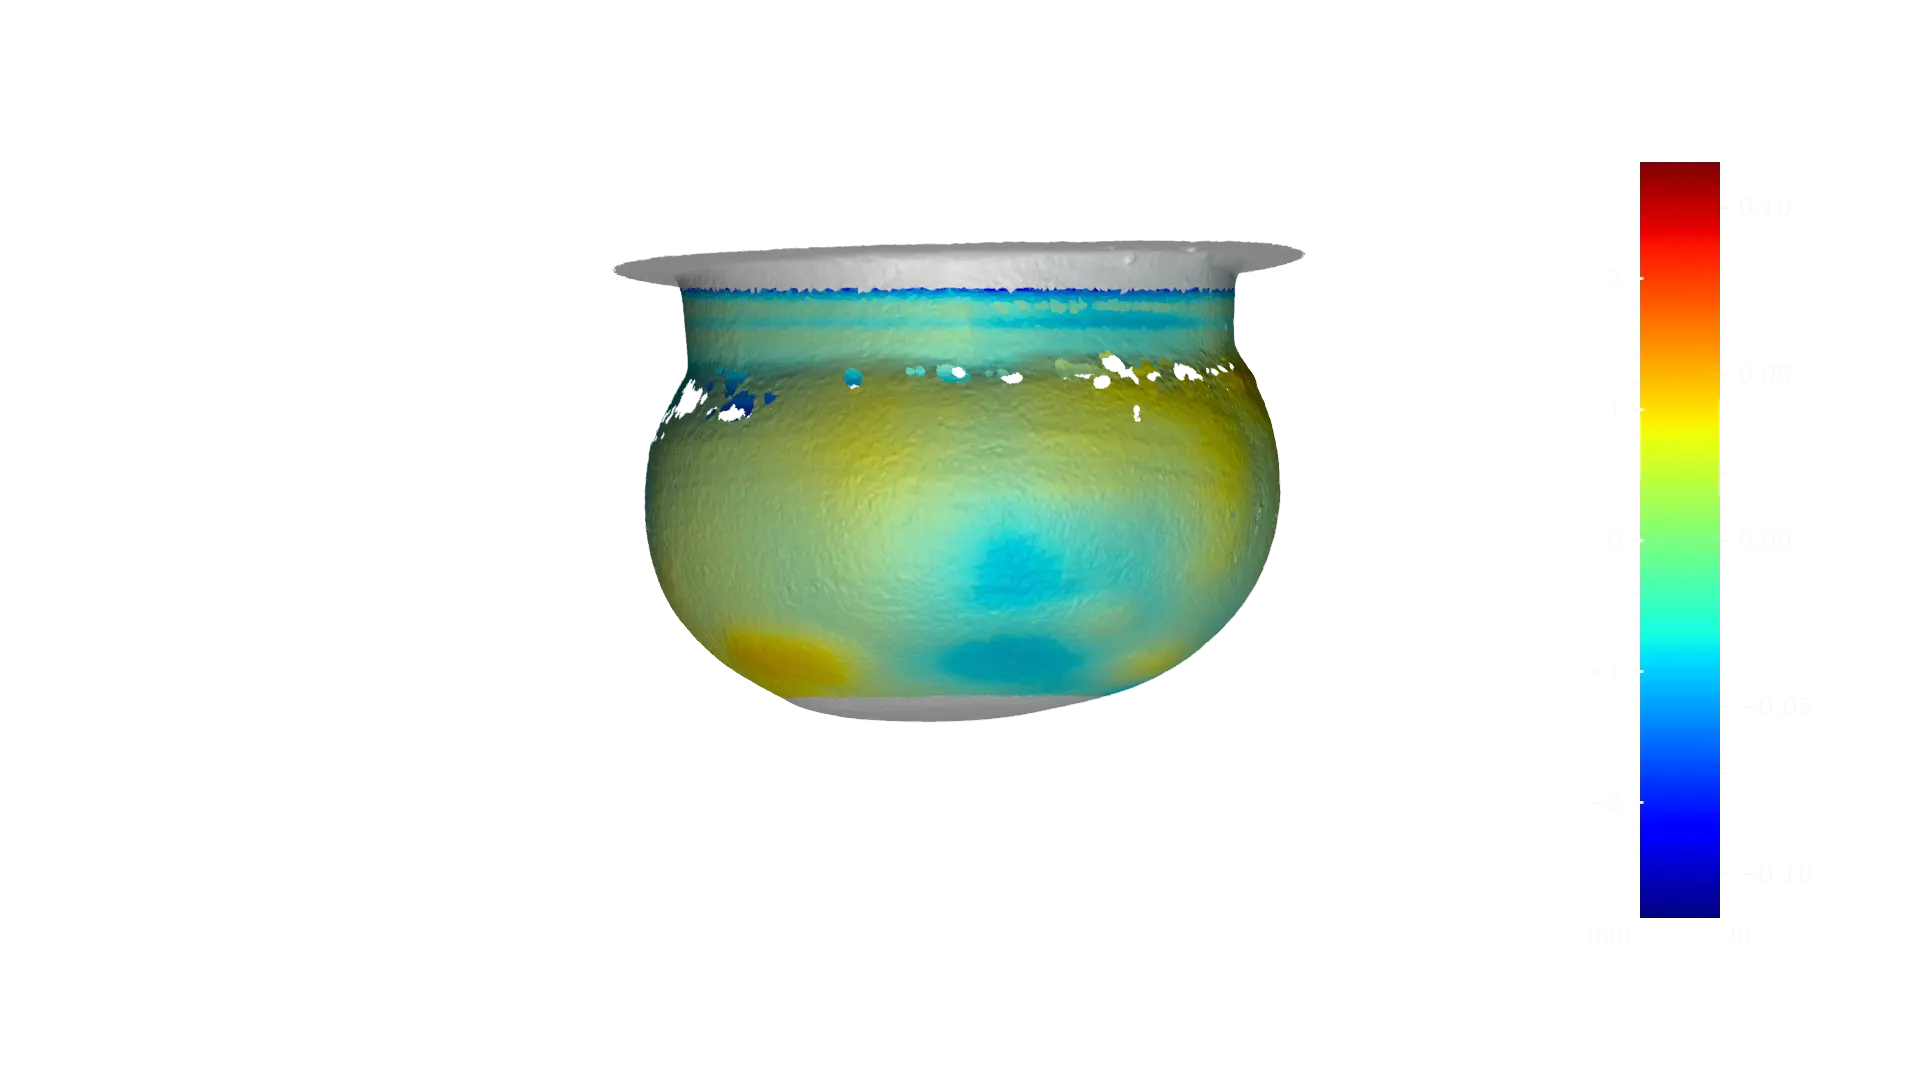
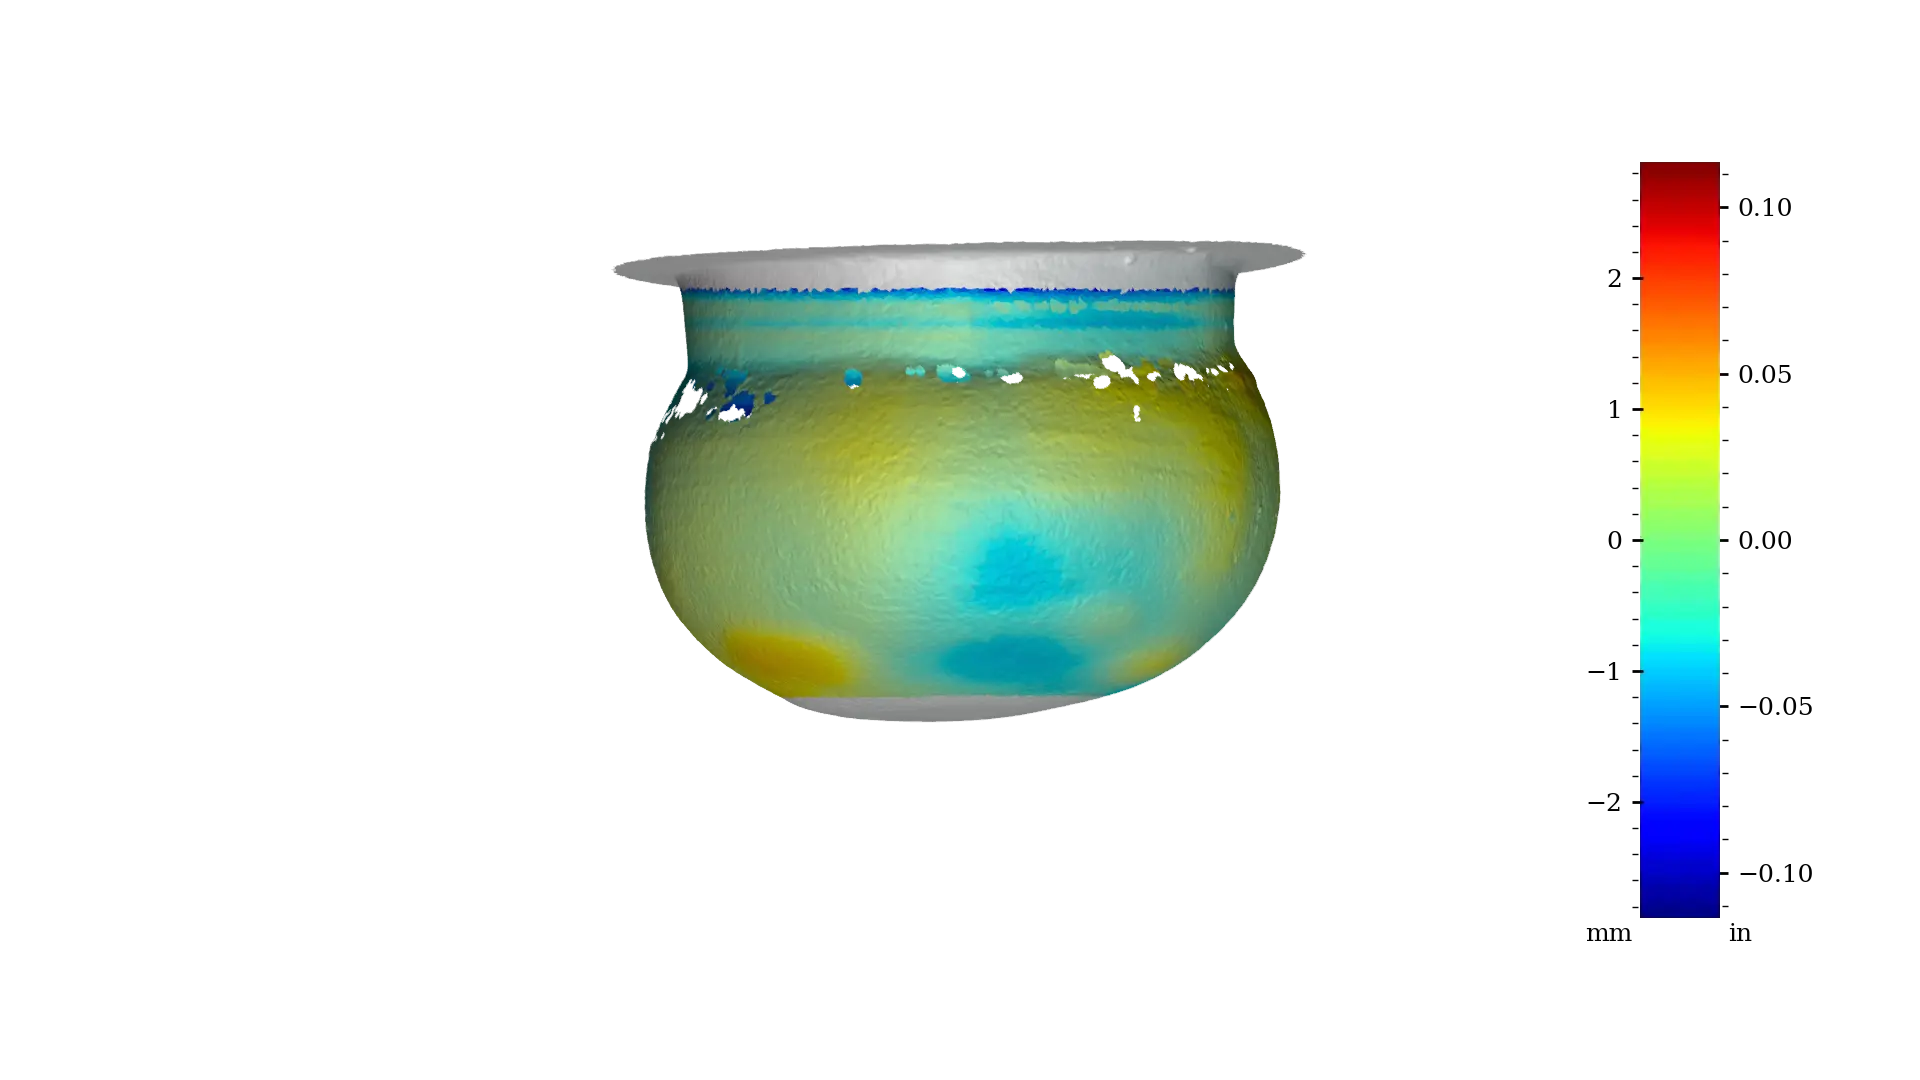 Figure 14 - RV003 interior full
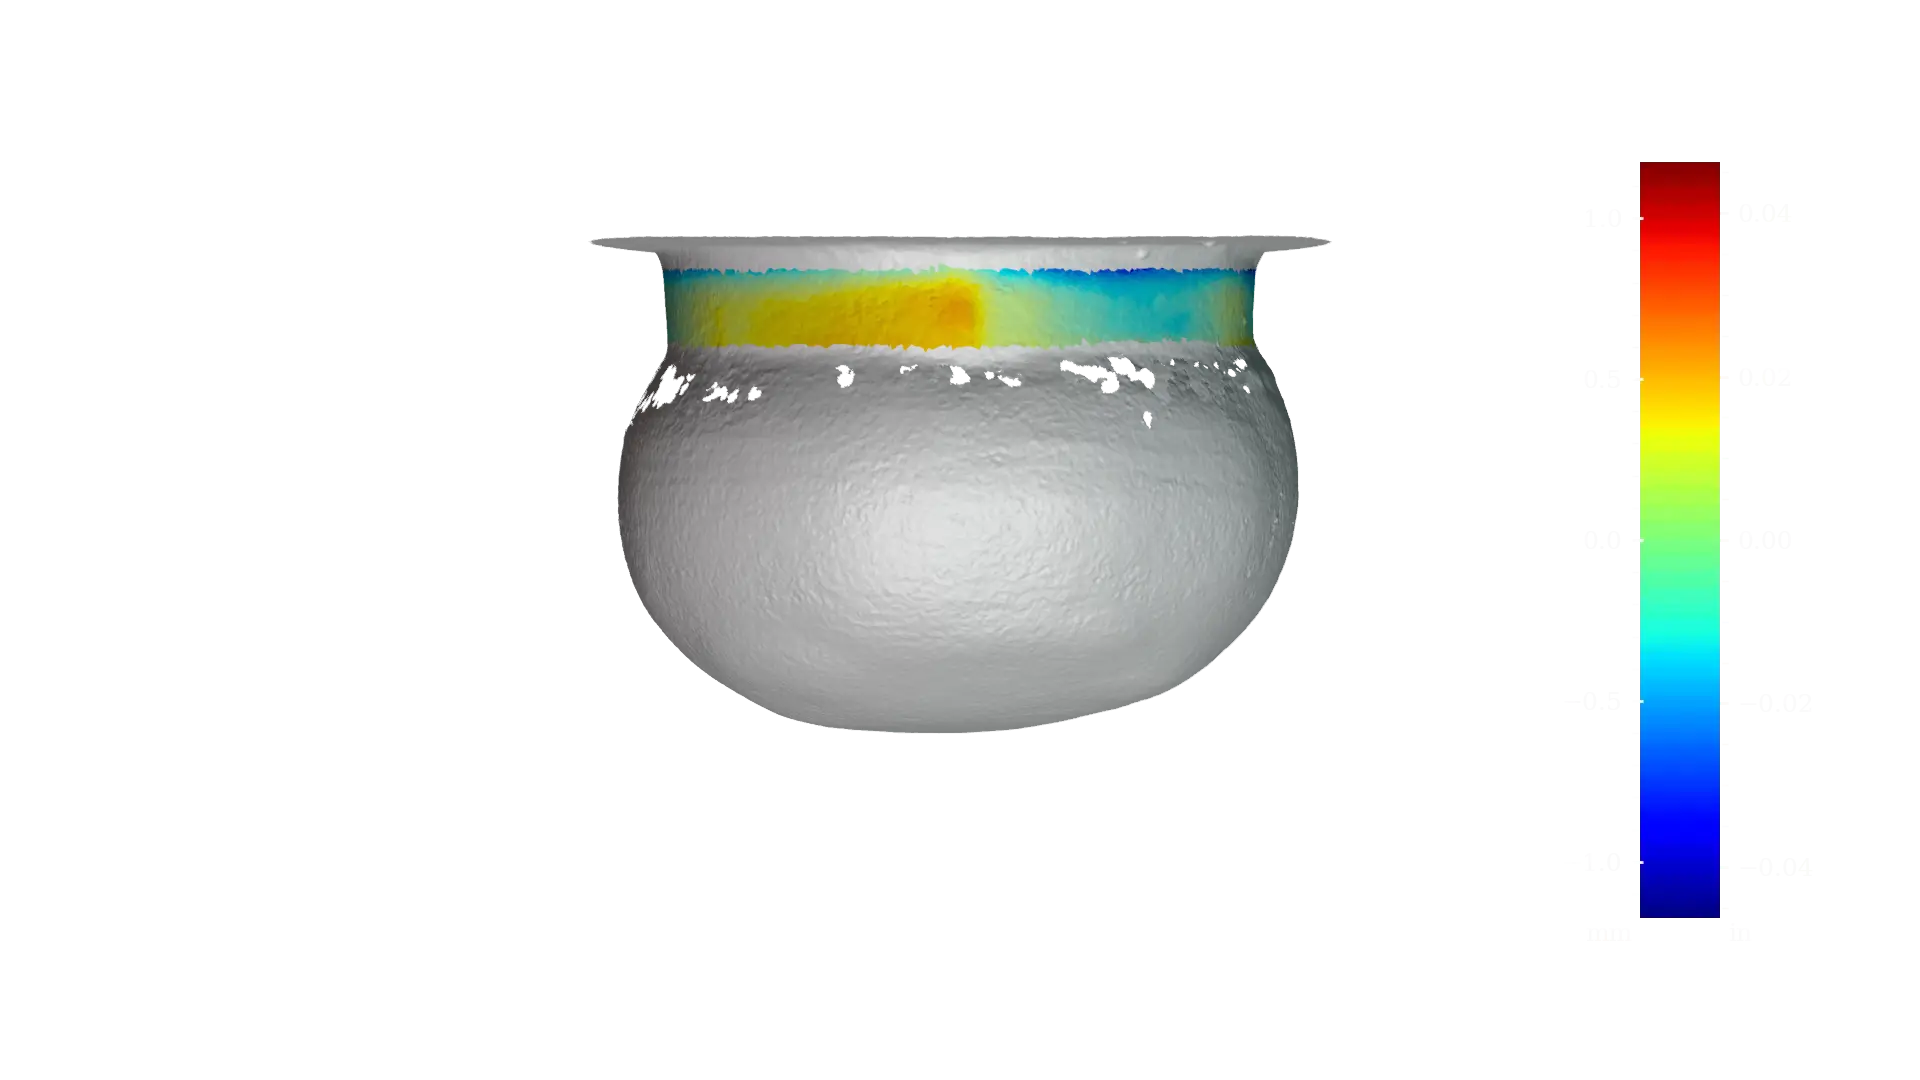
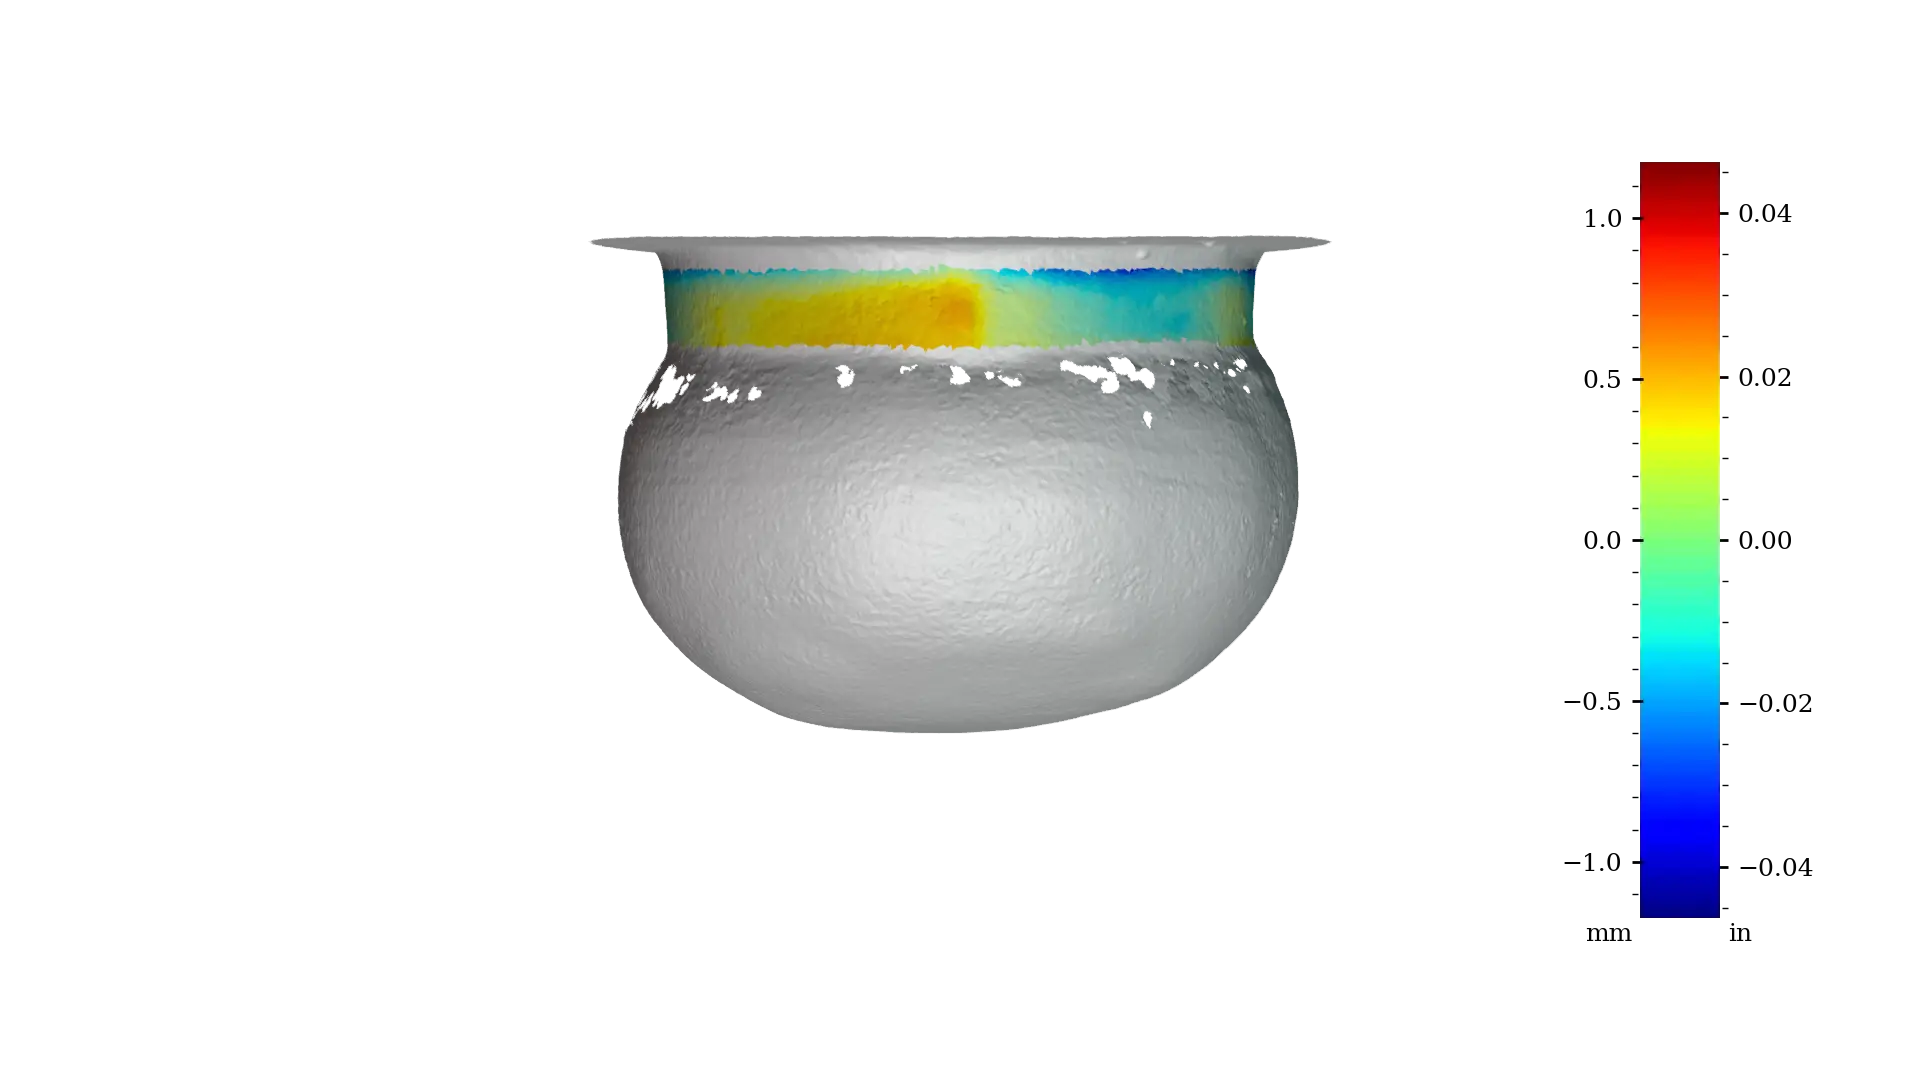 Figure 15 - RV003 interior opening
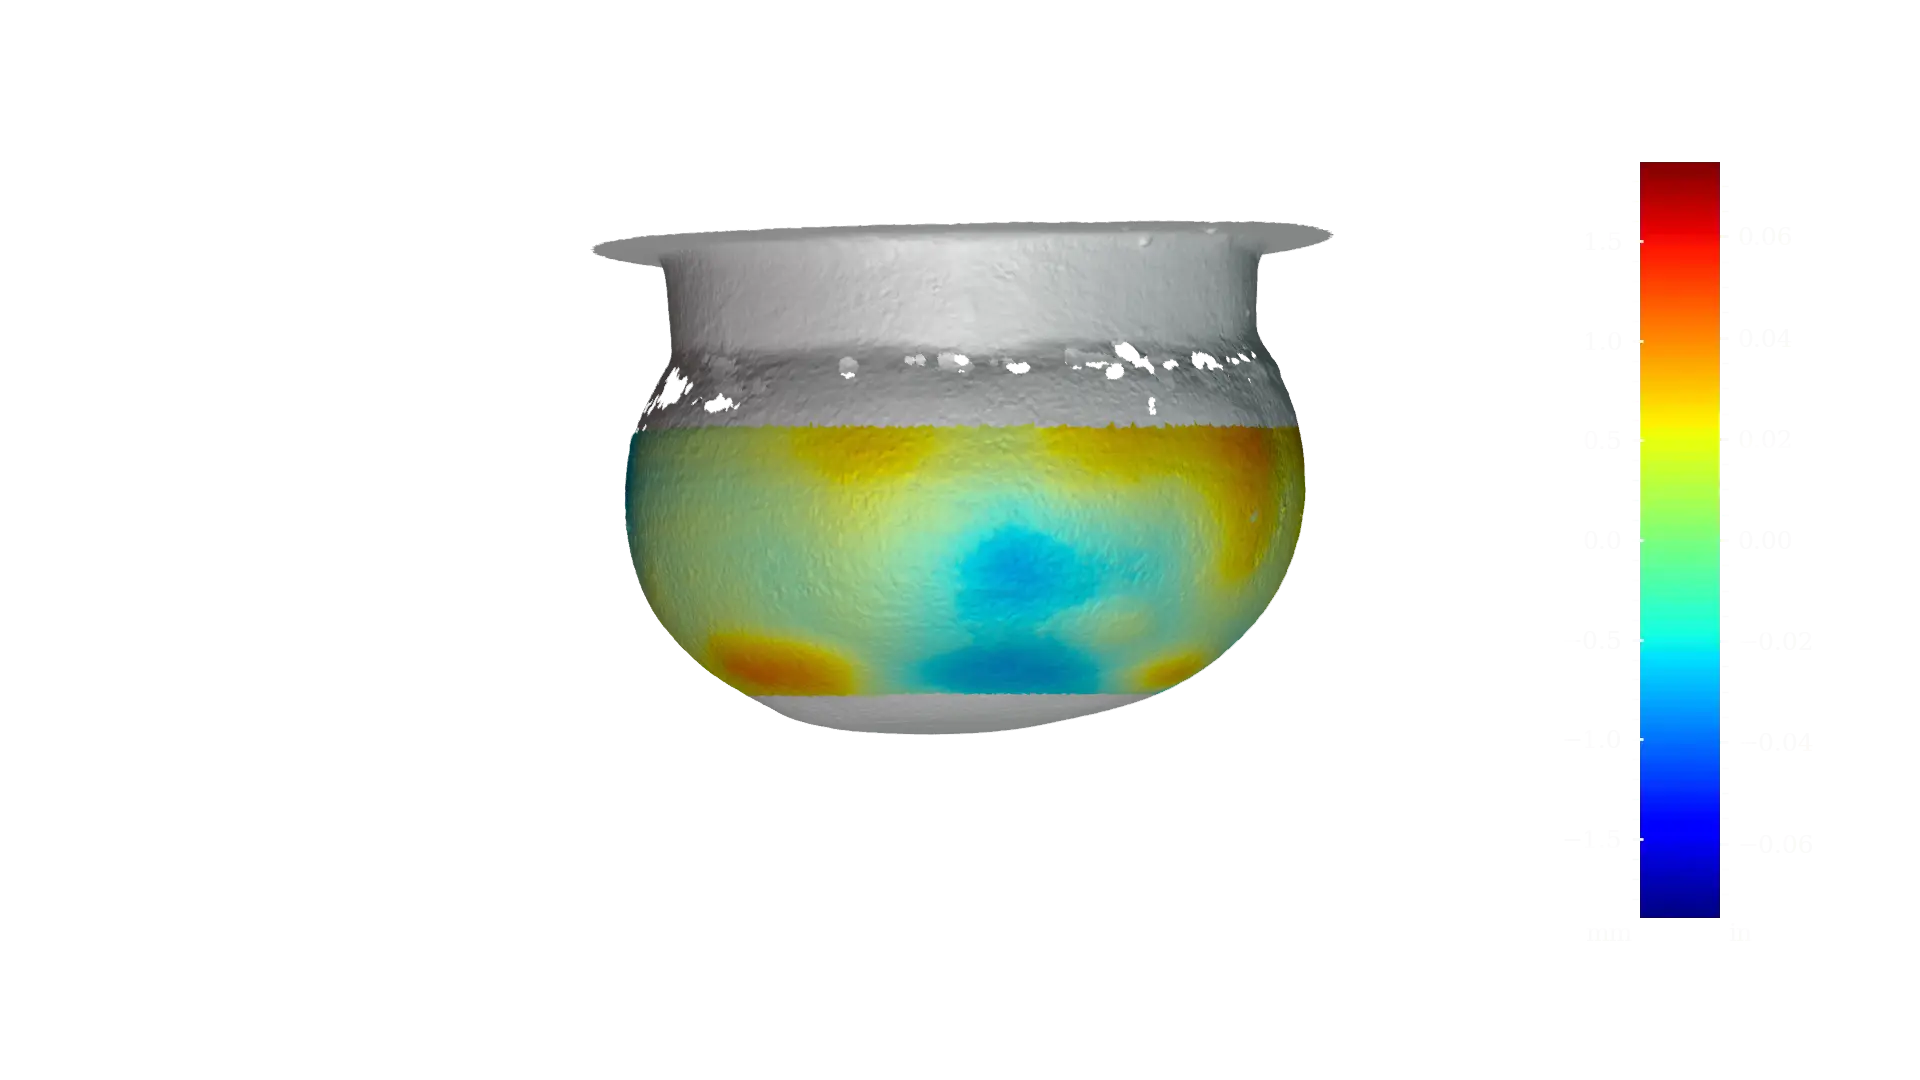
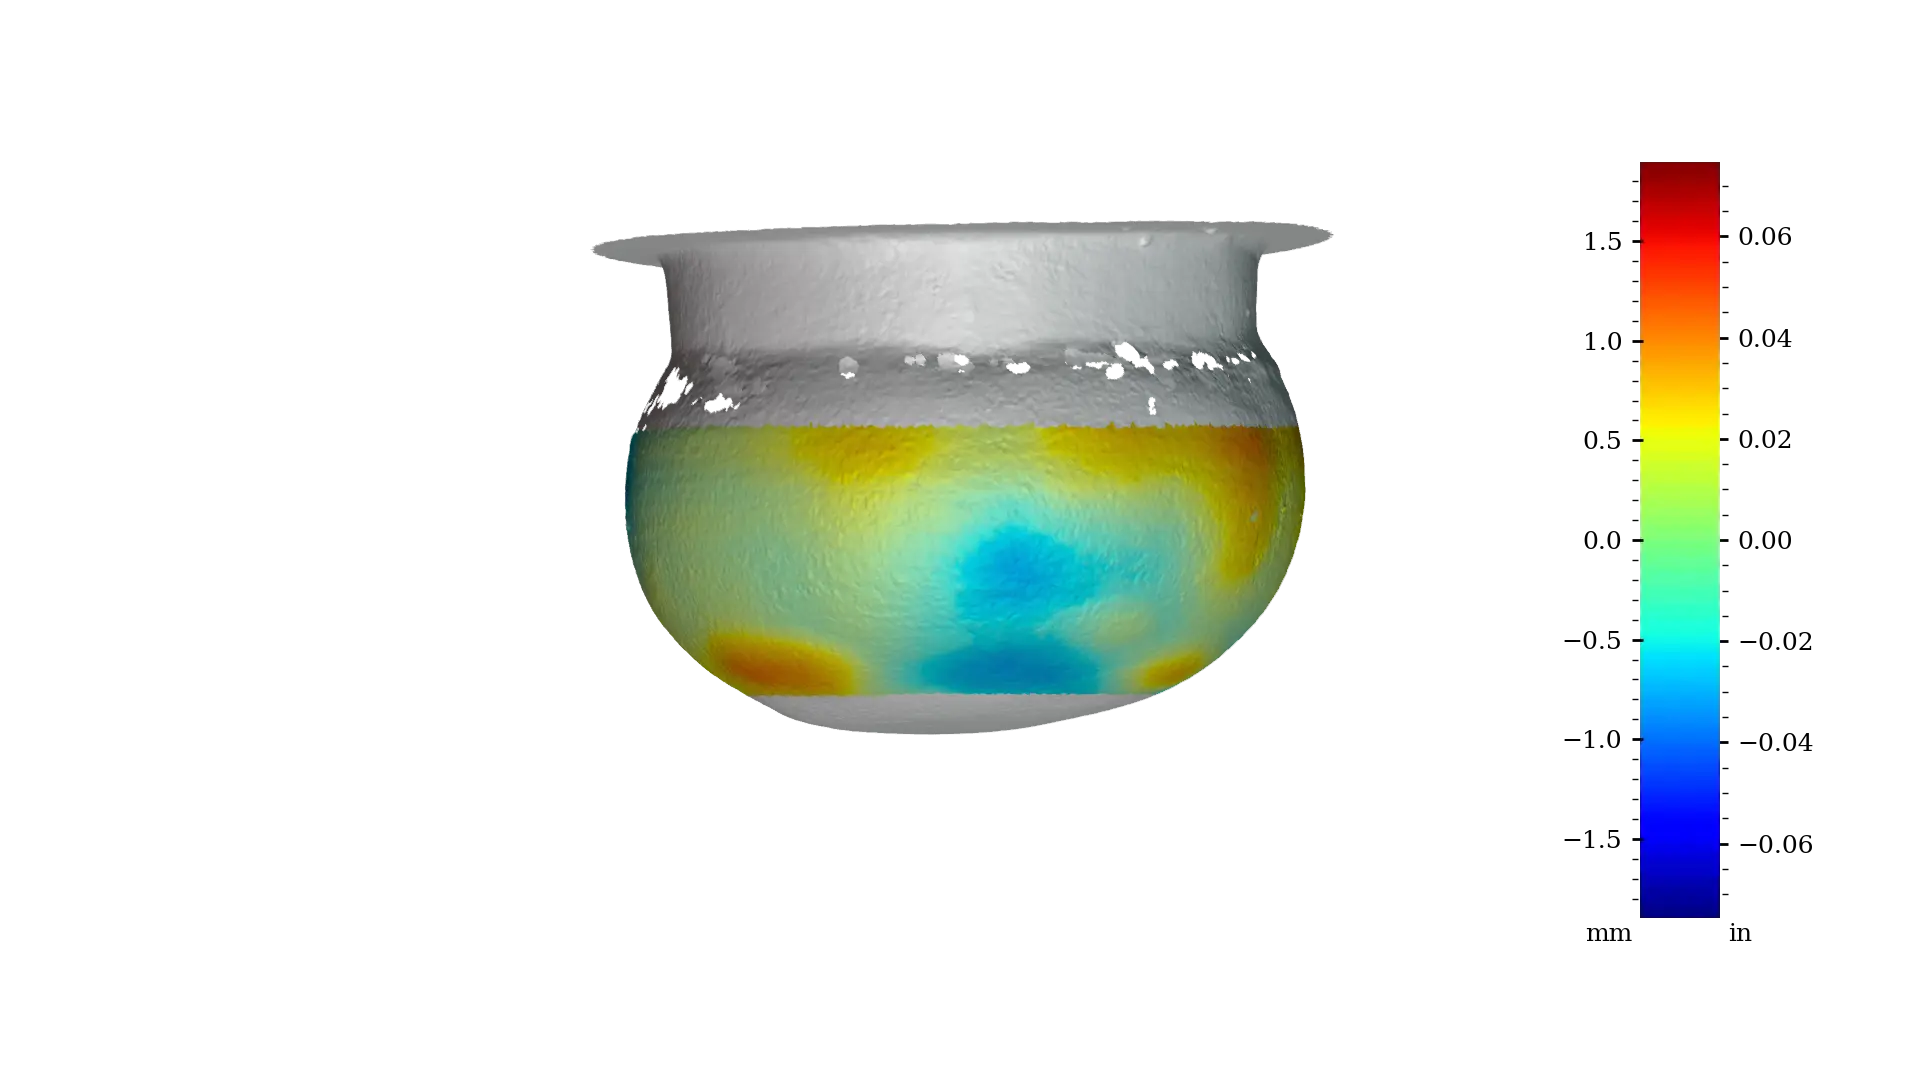 Figure 16 - RV003 interior cavity
The results reveal a striking inversion of precision distribution in MV003b: the opening and interior cavity are significantly more precise than the exterior surfaces. The rim region (opening) achieves an RMSD of just 32 µm (1.3 thou), with a peak-to-valley deviation (Range) of 251 µm (9.9 thou). This level of geometric control is exceptional, comparable to precision components in modern metrology, where circularity is tightly controlled.
Notably, the observed peak-to-valley Range of 251 µm (9.9 thou) of the opening area, corresponds directly to the circularity error, the total radial deviation between the most prominent high point and deepest low point relative to the best-fit circle. In industrial GD&T terms, this satisfies a circularity tolerance of 0.25 mm (0.010 inch), a specification typical of precision machined components.
The measurement was taken over a short axial segment of 5 mm (0.2 inch) at the vessel’s opening, a region with nearly vertical walls. Even more remarkable is the precision of the interior cavity, where the maximum peak-to-valley deviation (Range) is 485 µm (19.1 thou) across the entire worked surface. This means that over the scanned area of the cavity, the internal profile deviates from its best-fit circular form by less than half a millimeter, an extraordinary achievement for a vessel carved from hard basalt using only abrasive powders and manual rotation.
Such geometric fidelity, achieved in a 5,000-year-old basalt vessel, without powered tools or rigid machine guidance, underscores the exceptional skill, possessed by Predynastic craftsmen, rivaling standards found in modern precision engineering.
In contrast, the exterior surfaces show markedly higher deviations, particularly in the upper zone (Range: 1245 µm / 49 thou). While this may reflect less emphasis on exterior finishing, a likely alternative explanation is post-depositional weathering. Basalt is prone to exfoliation, a process in which thermal and chemical stresses cause thin layers to spall off the surface over time. This could introduce surface undulations that artificially degrade the measured precision. While no definitive evidence of active exfoliation is visible in the scan data, the possibility cannot be ruled out and warrants material-specific investigation.
The replica RV003, crafted by Olga Vdovina using reconstructed Neolithic techniques (hammerstones, abrasives, wooden shafts), serves as a preliminary benchmark. As her first attempt at vessel production, it reflects initial learning rather than optimized skill. Unsurprisingly, its range values are higher than those of MV003b. Notably, even its interior opening (Range: 2402 µm / 94.6 thou) is less precise than the least accurate region of the ancient vessel.
Ellipticity, measurable deviation from circular symmetry toward an elliptical cross-section, has been detected in 14 of the 32 scanned vessels from the Petrie Museum collection, all but two of which are carved from basalt (12 out of 18 basalt vessels). In contrast, the diorite and porphyry vessels in the sample exhibit only minimal or negligible ellipticity. Notably, no elliptical shaping has been observed in any vessel from private collections, suggesting either a selection bias, differences in provenance, or distinct manufacturing traditions.
Crucially, ellipticity is confined to the external surface, while the internal cavity remains consistently circular across all vessels. Basalt is susceptible to exfoliation, a surface spalling process, but this mechanism acts isotropically and cannot produce a coherent, axis-aligned elliptical profile localized to specific regions. The preservation of perfect internal circularity alongside externally expressed ellipticity provides compelling evidence for intentional, controlled shaping during manufacture. Figure 17 shows top-down view of all 14 elliptical vessels.
 MV012
MV012
 MV016b
 MV018b
 MV019b
 MV020
MV020
 MV021b
 MV023
MV023
 MV024
MV024
 MV025
MV025
 MV026
MV026
 MV027
MV027
 MV028
MV028
 MV029
MV029
 MV031
MV031
Figure 17: Top-down views of all 14 elliptical vessels, showing external ellipticity with preserved internal circularity.
When aligned to their principal elliptical axes, the handles are not symmetrically positioned relative to the major or minor axis. This asymmetry, consistent across all elliptical vessels, will be explored in depth in a forthcoming article.
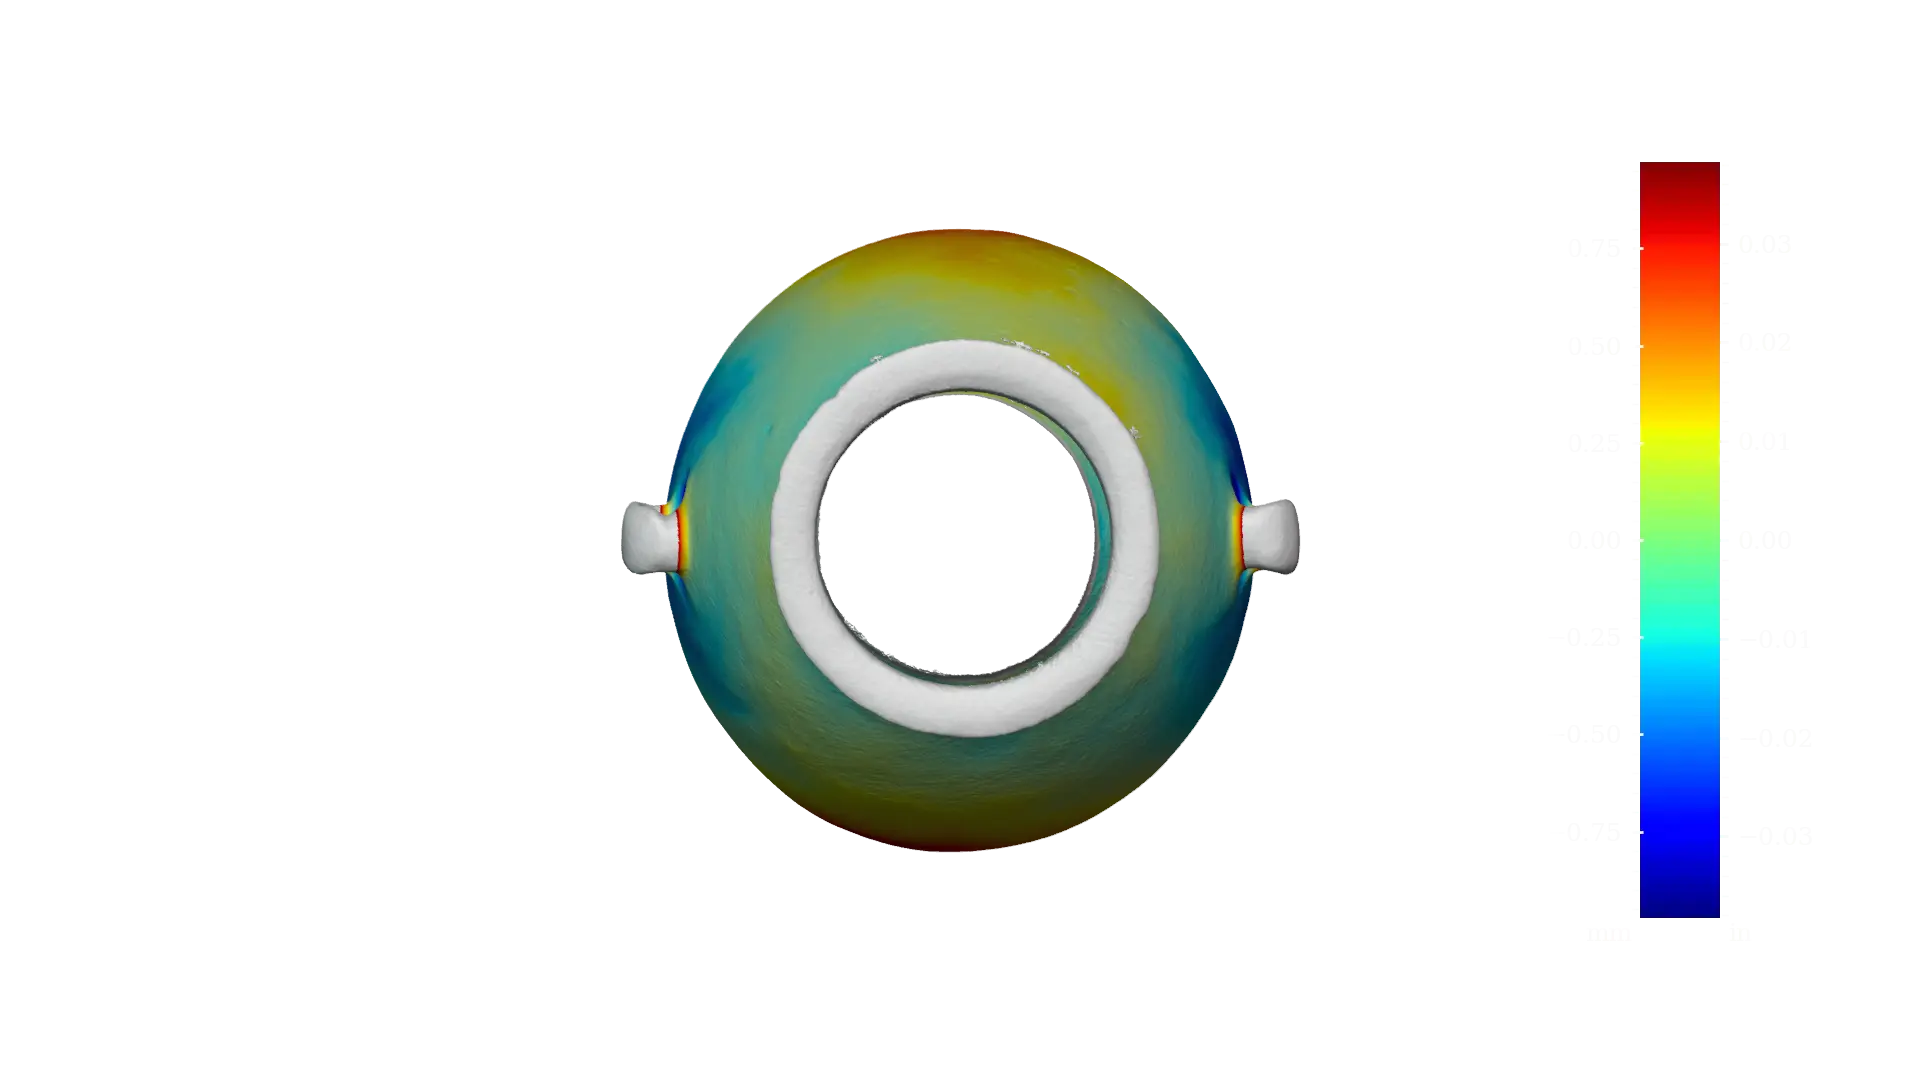
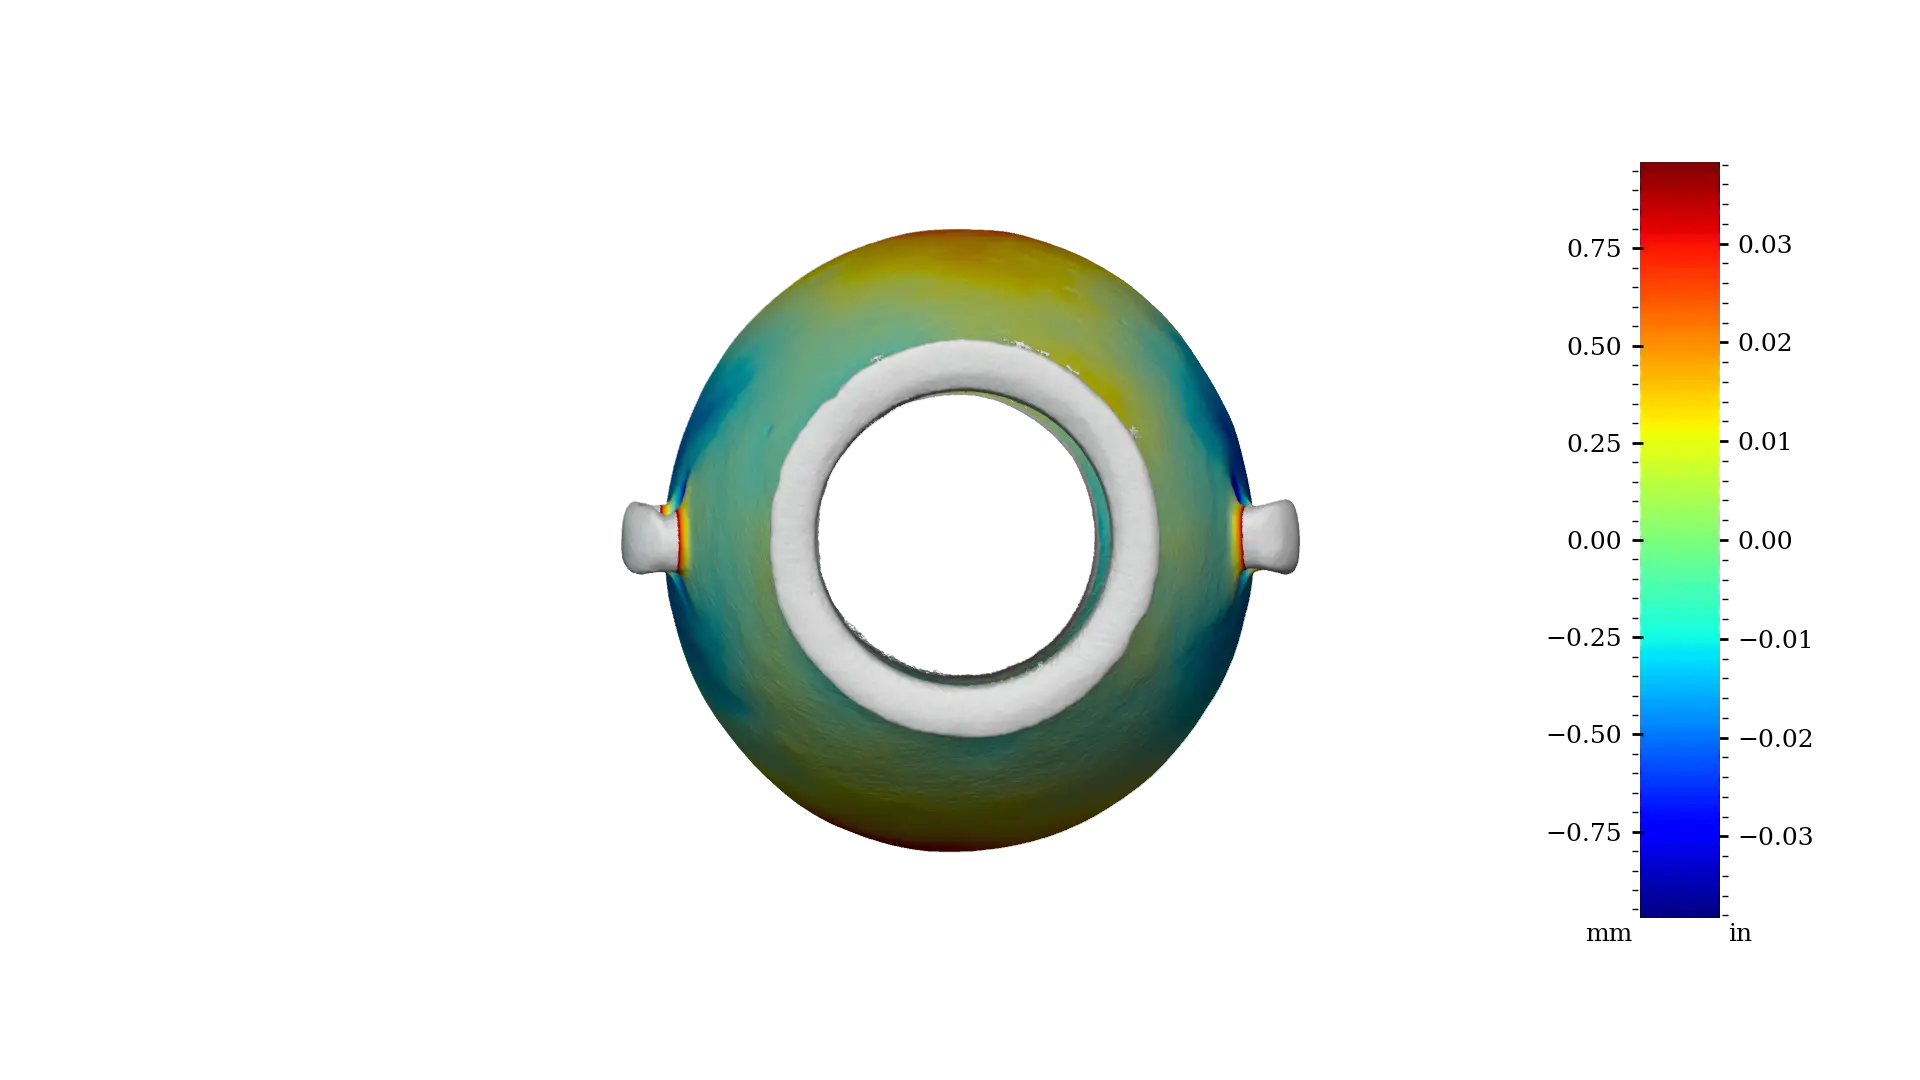
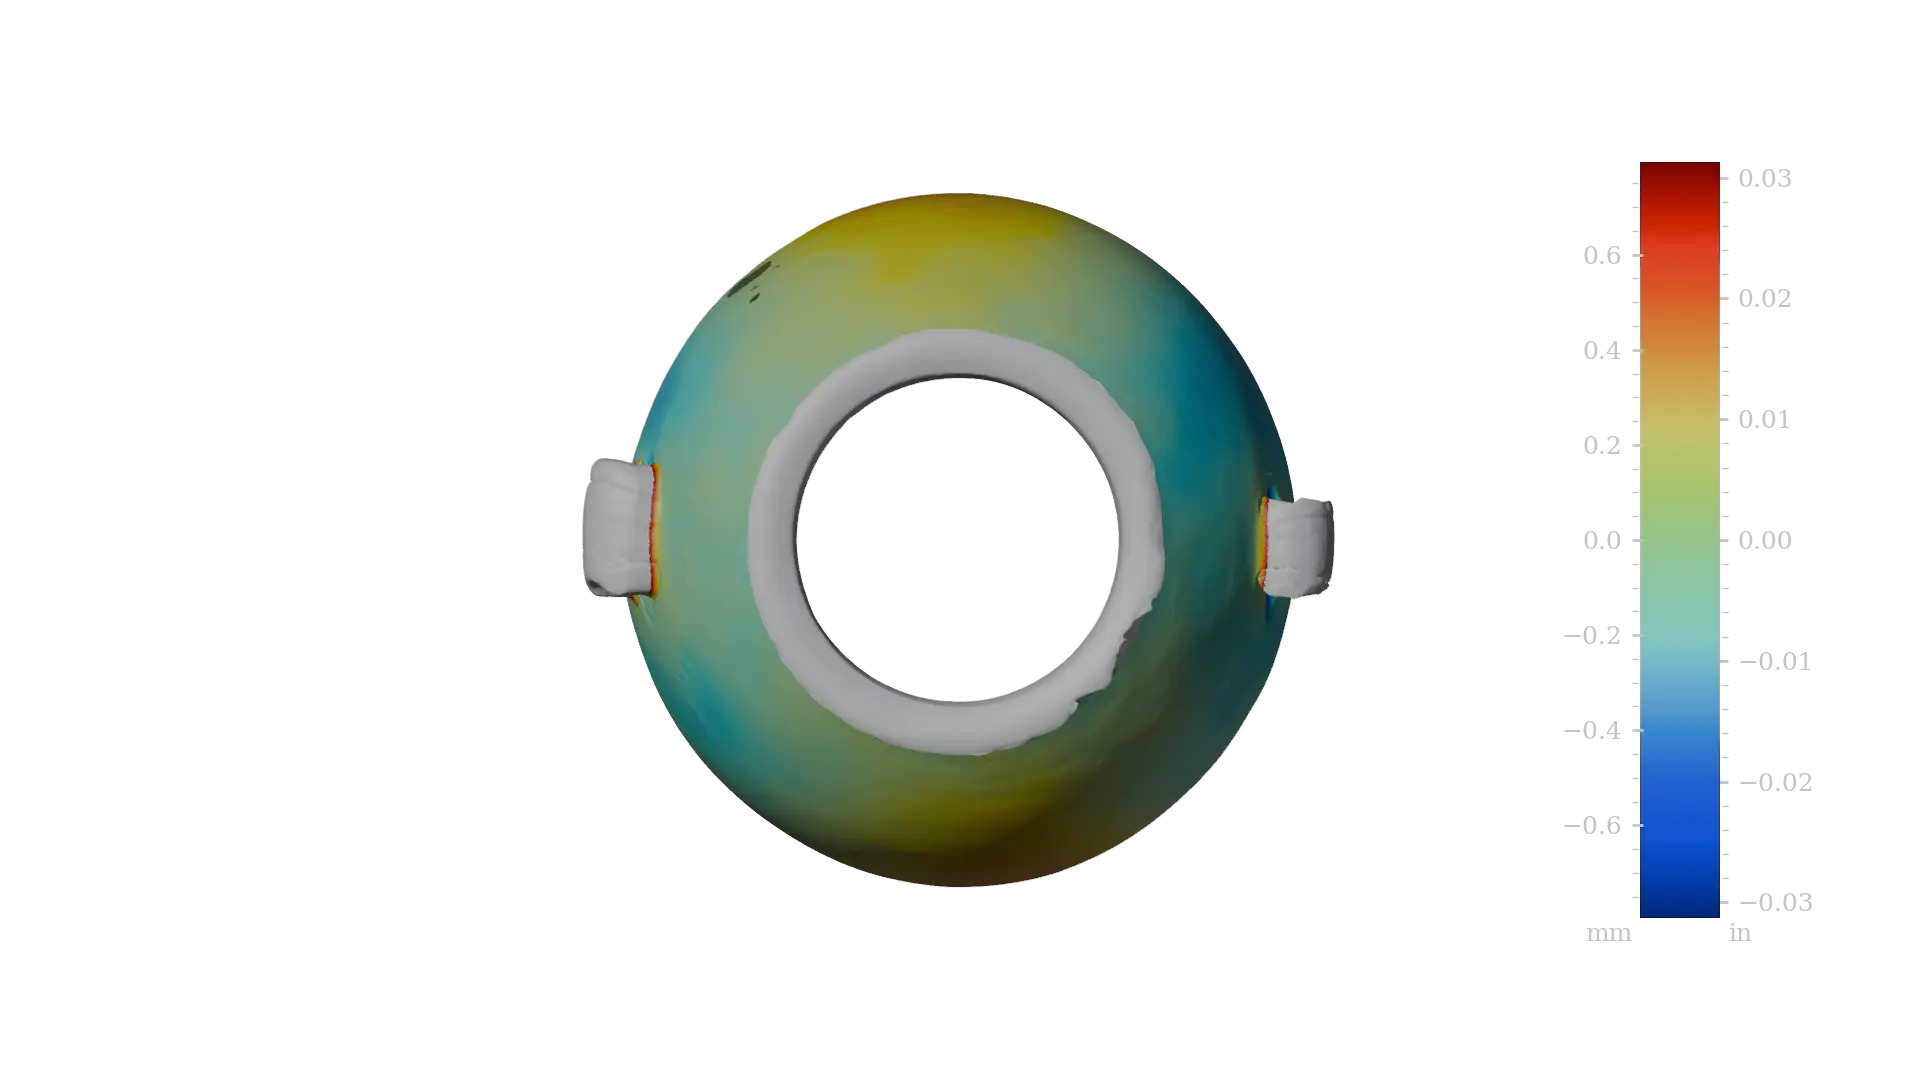
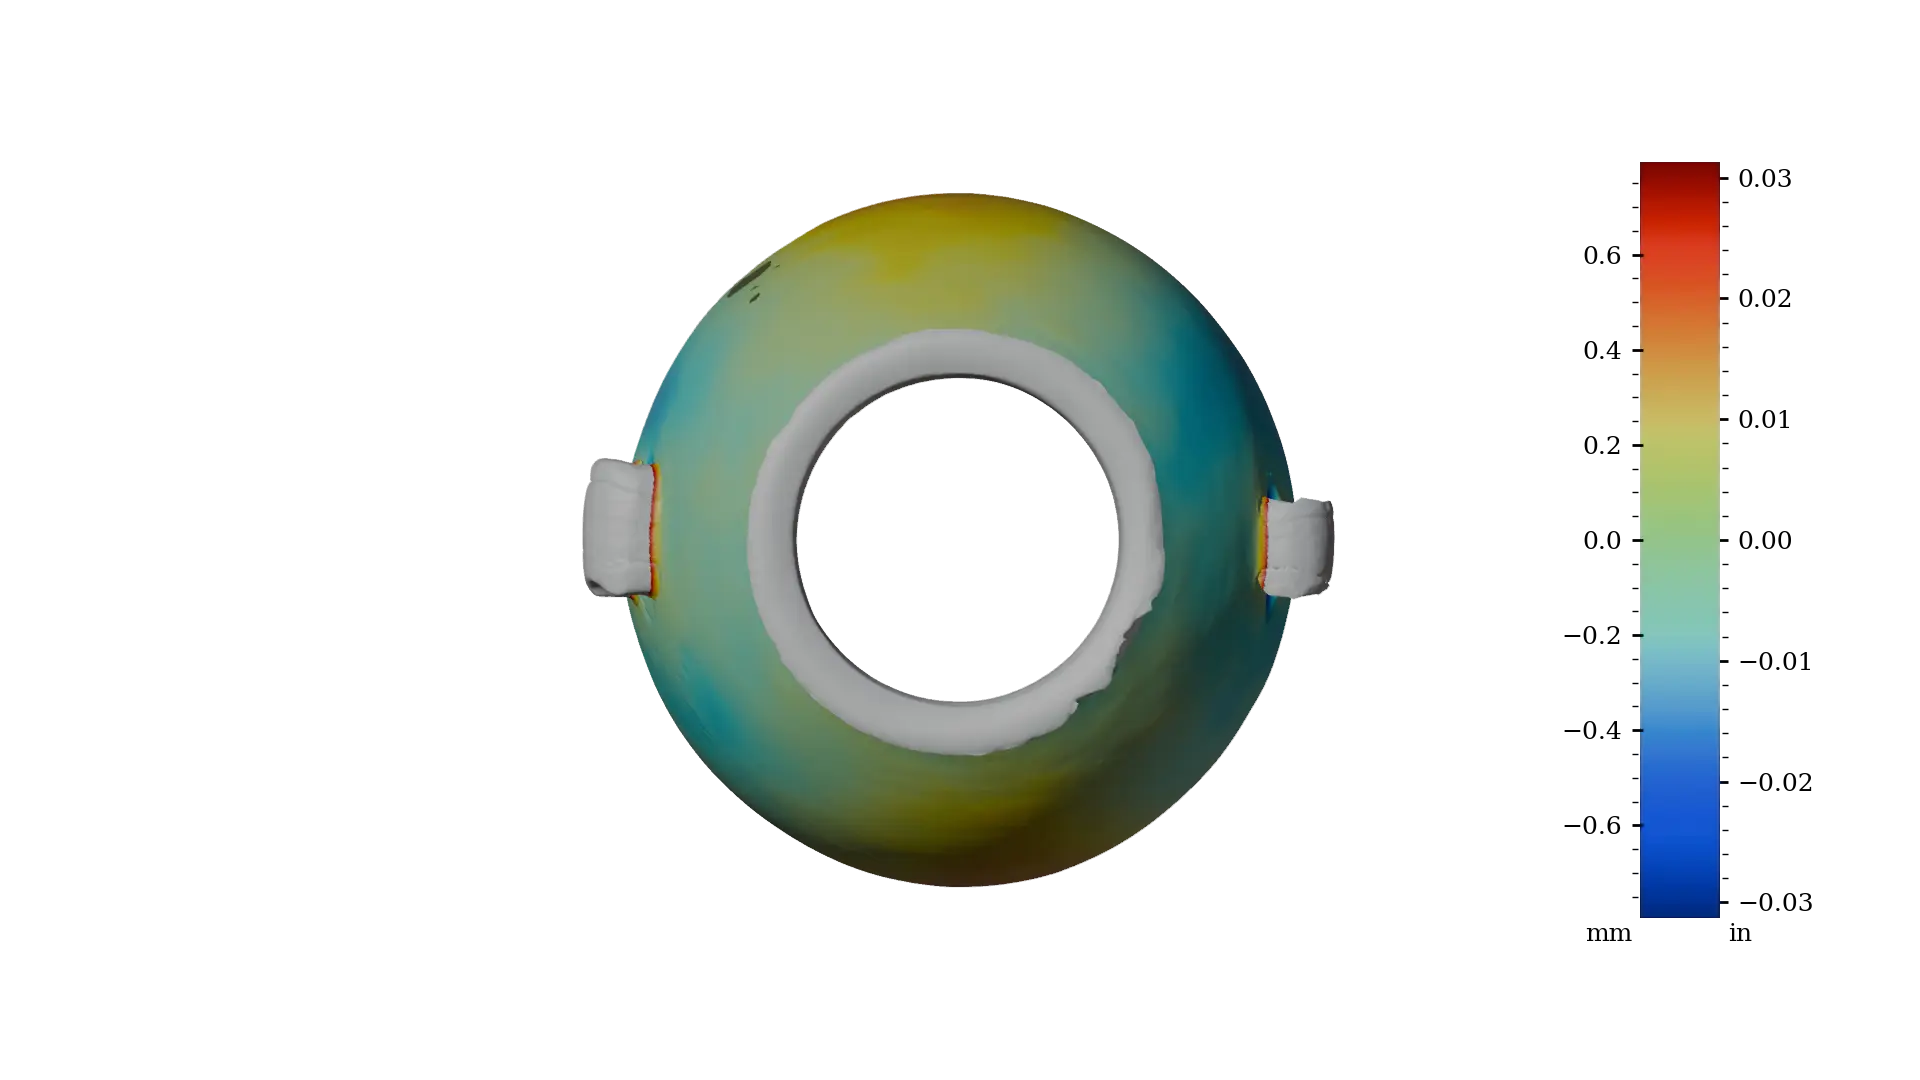
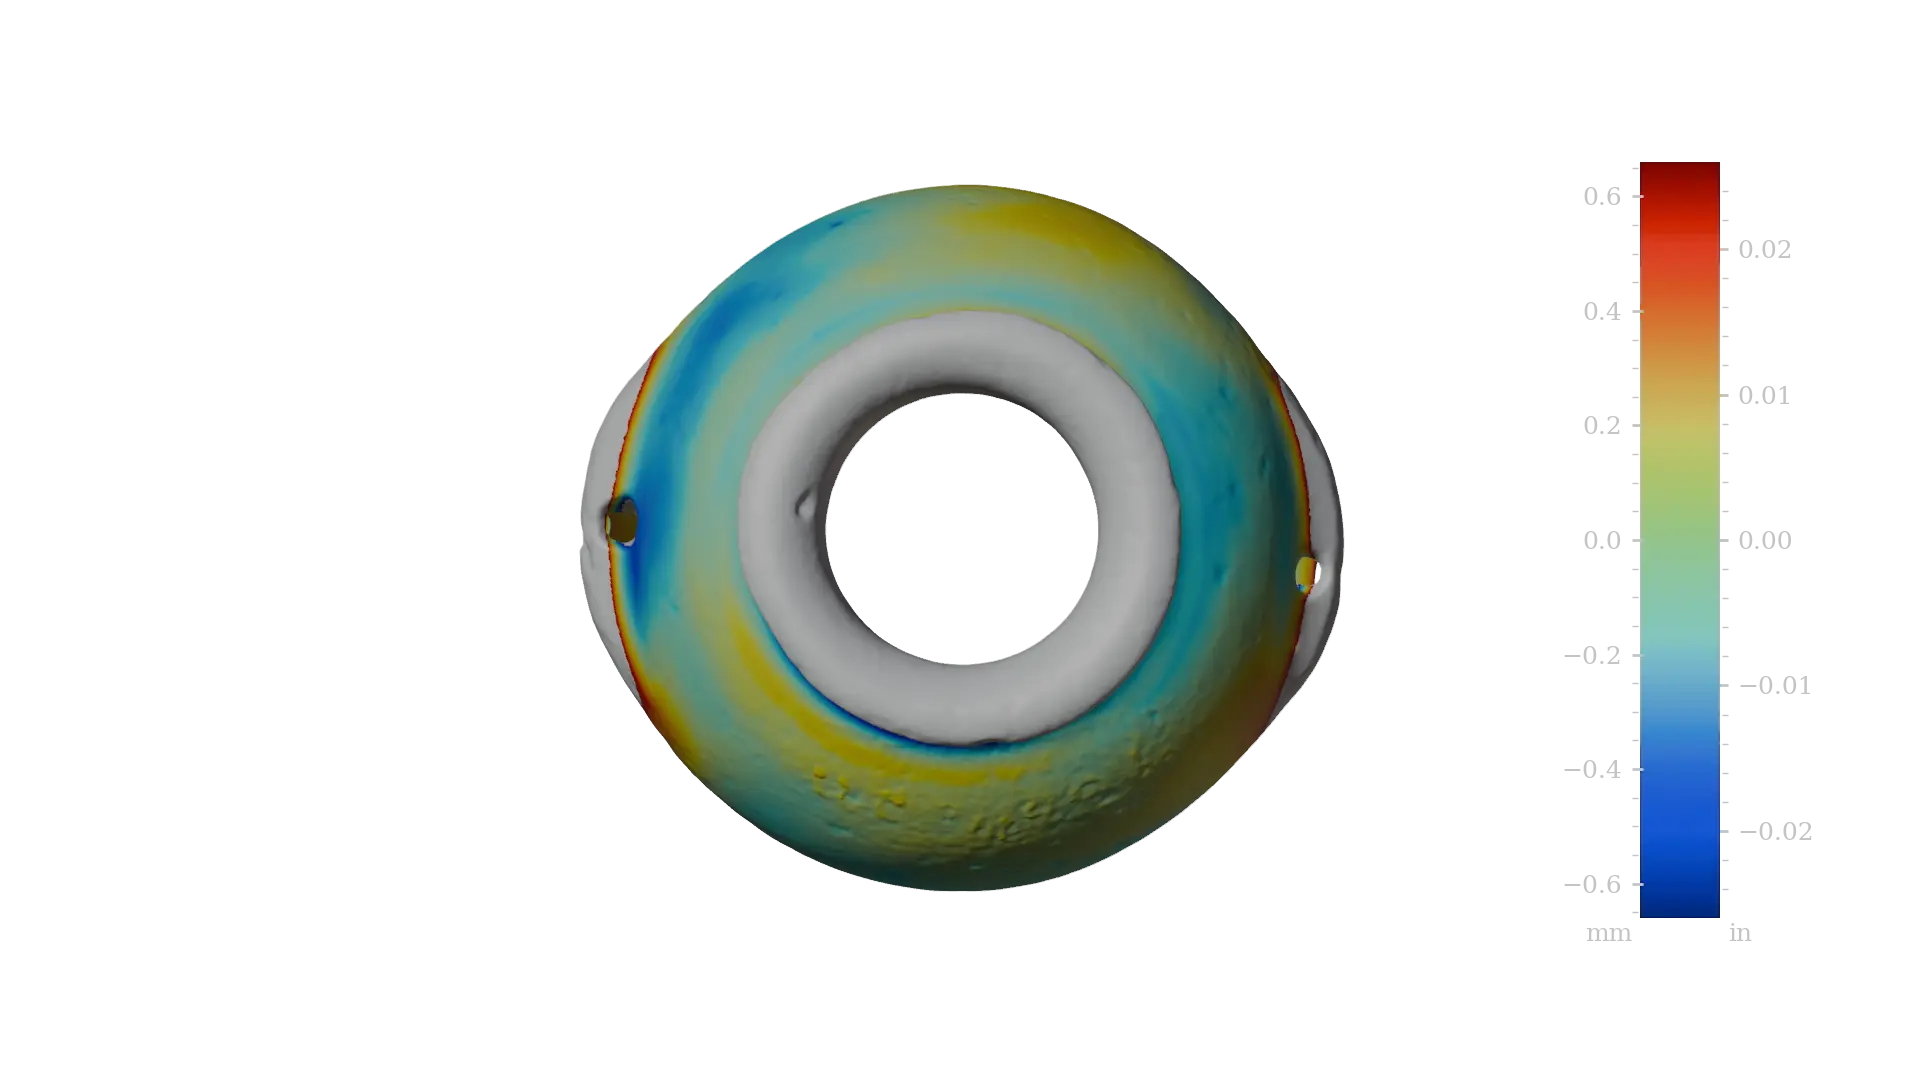
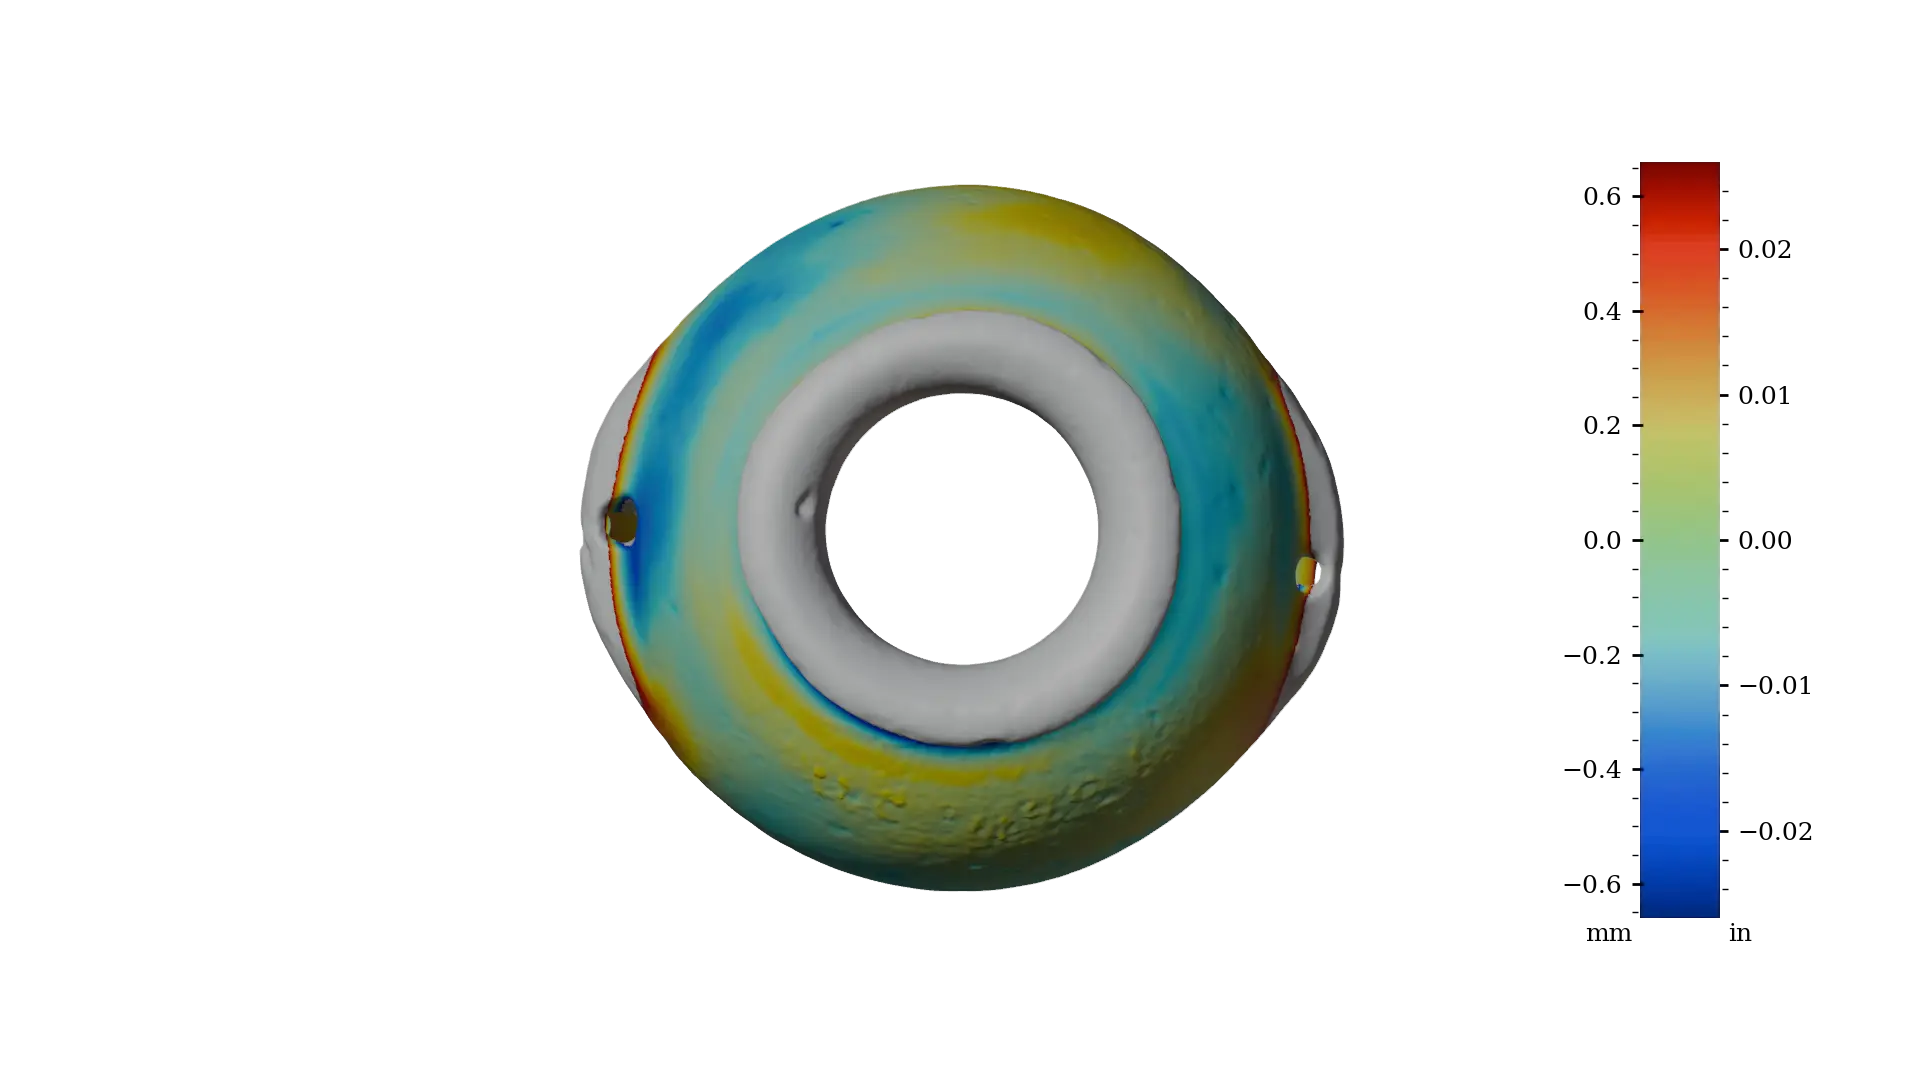
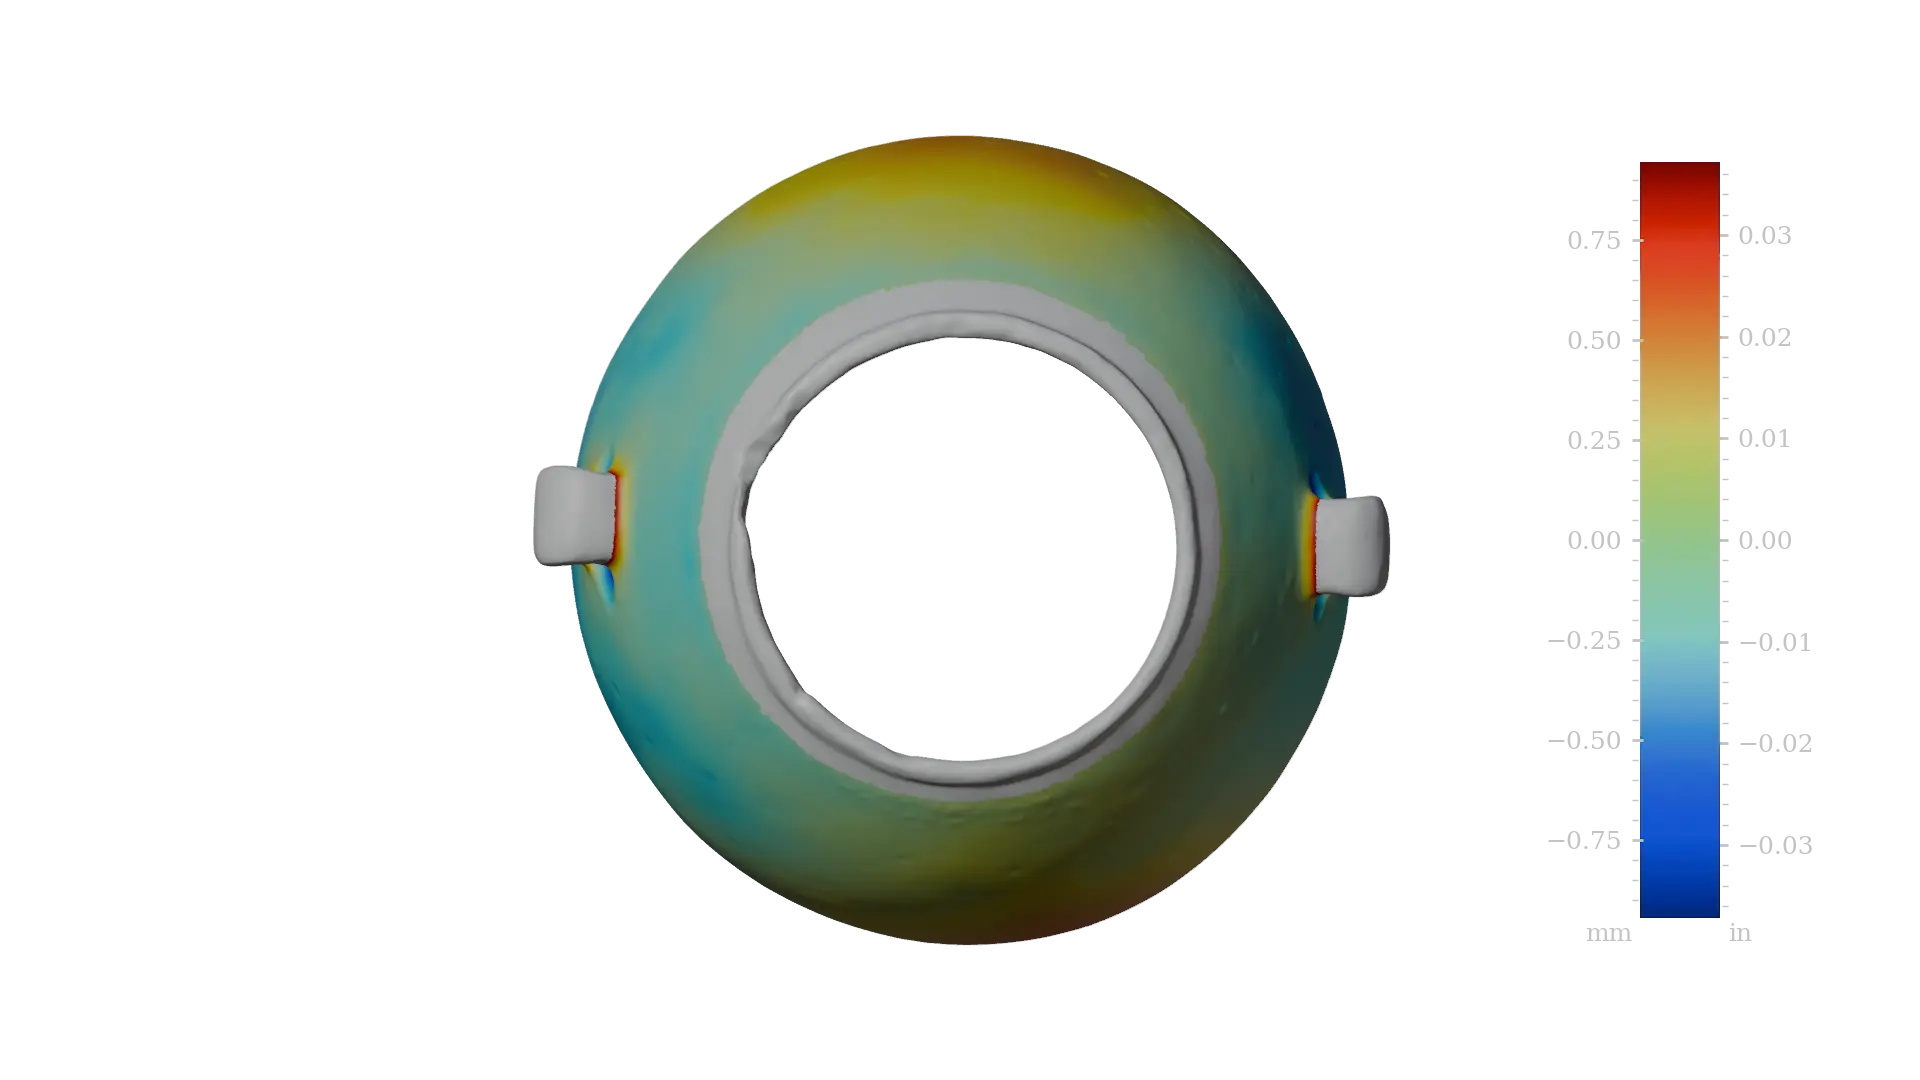
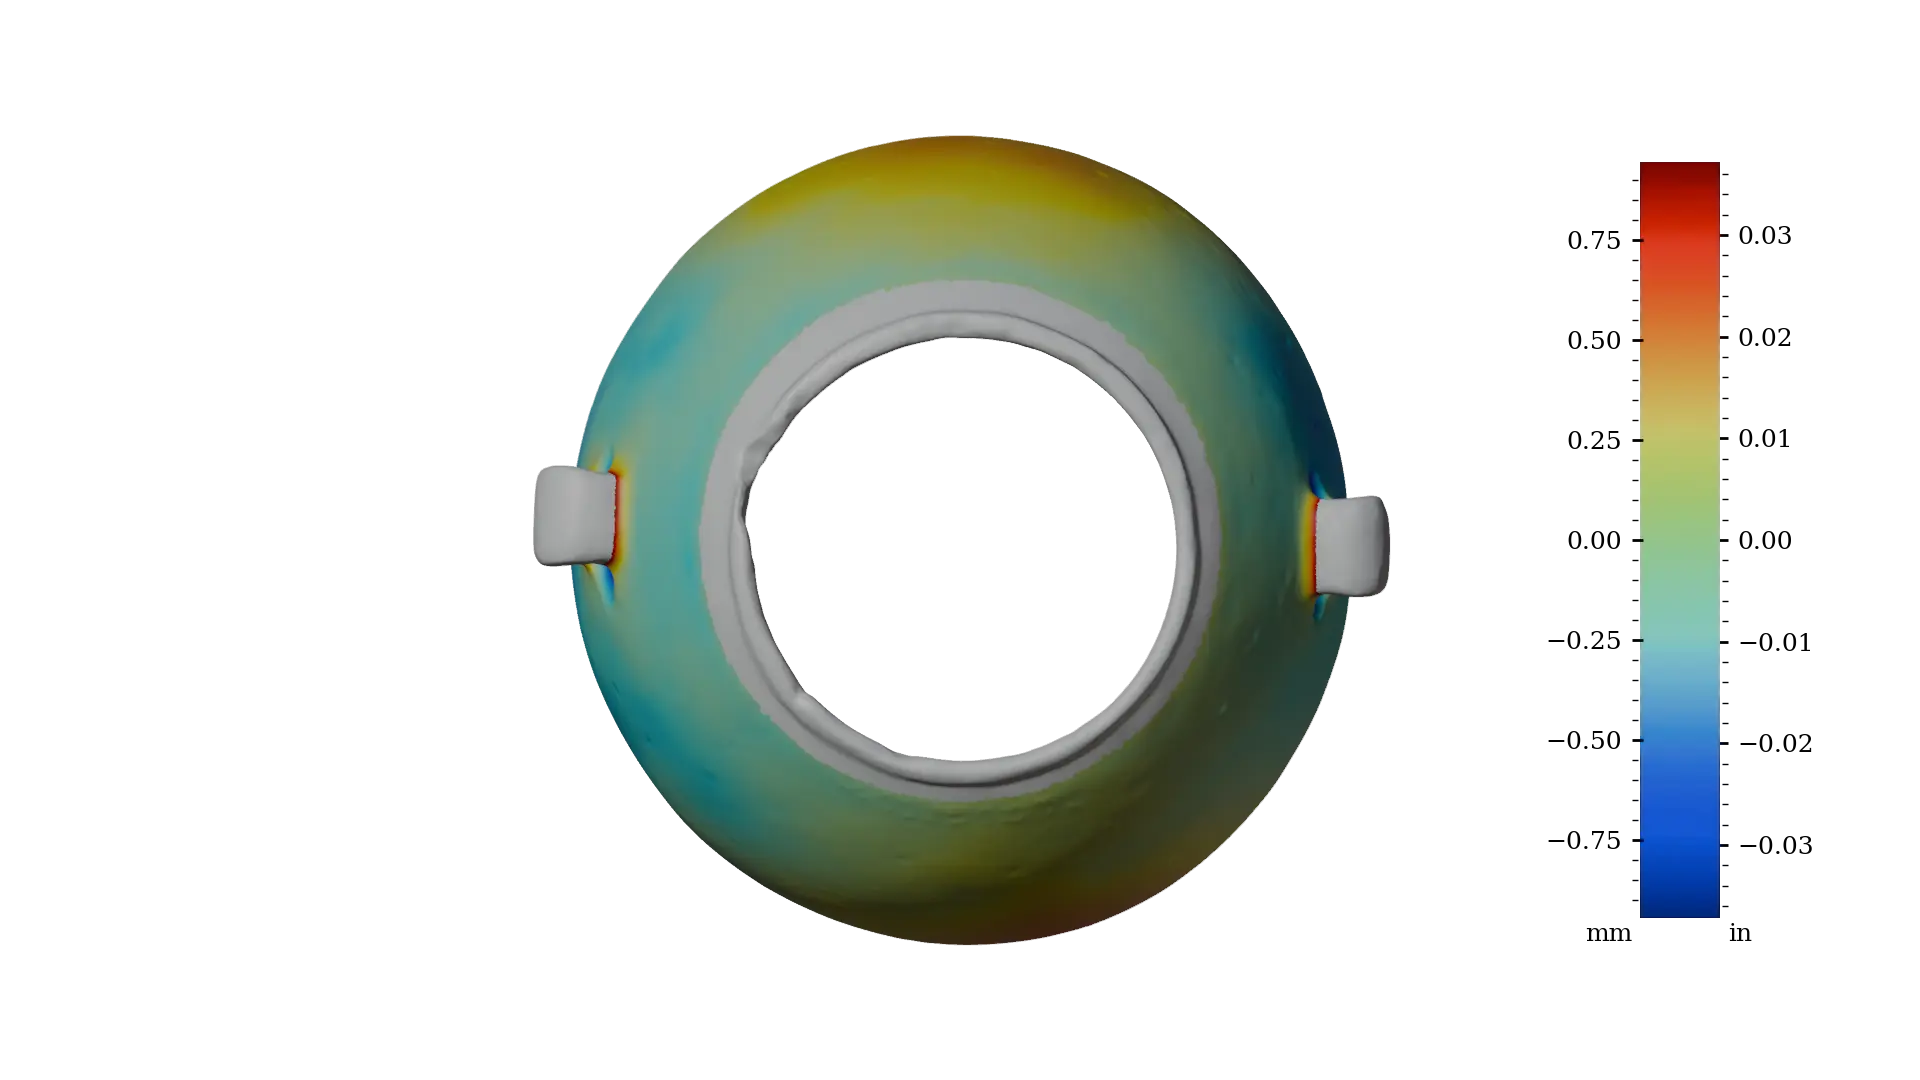
Notably, even in vessels with pronounced ellipticity, the upper extremities remain circular, with ellipticity concentrated in the central and lower body (see Figure 18 and 19).
MV020 exemplifies this pattern: this basalt vessel exhibits high circular precision in both the interior and the upper exterior region, while the midsection displays clear ellipticity, the lower region shows ellipticity to a lesser extend, a pattern repeated across the group.
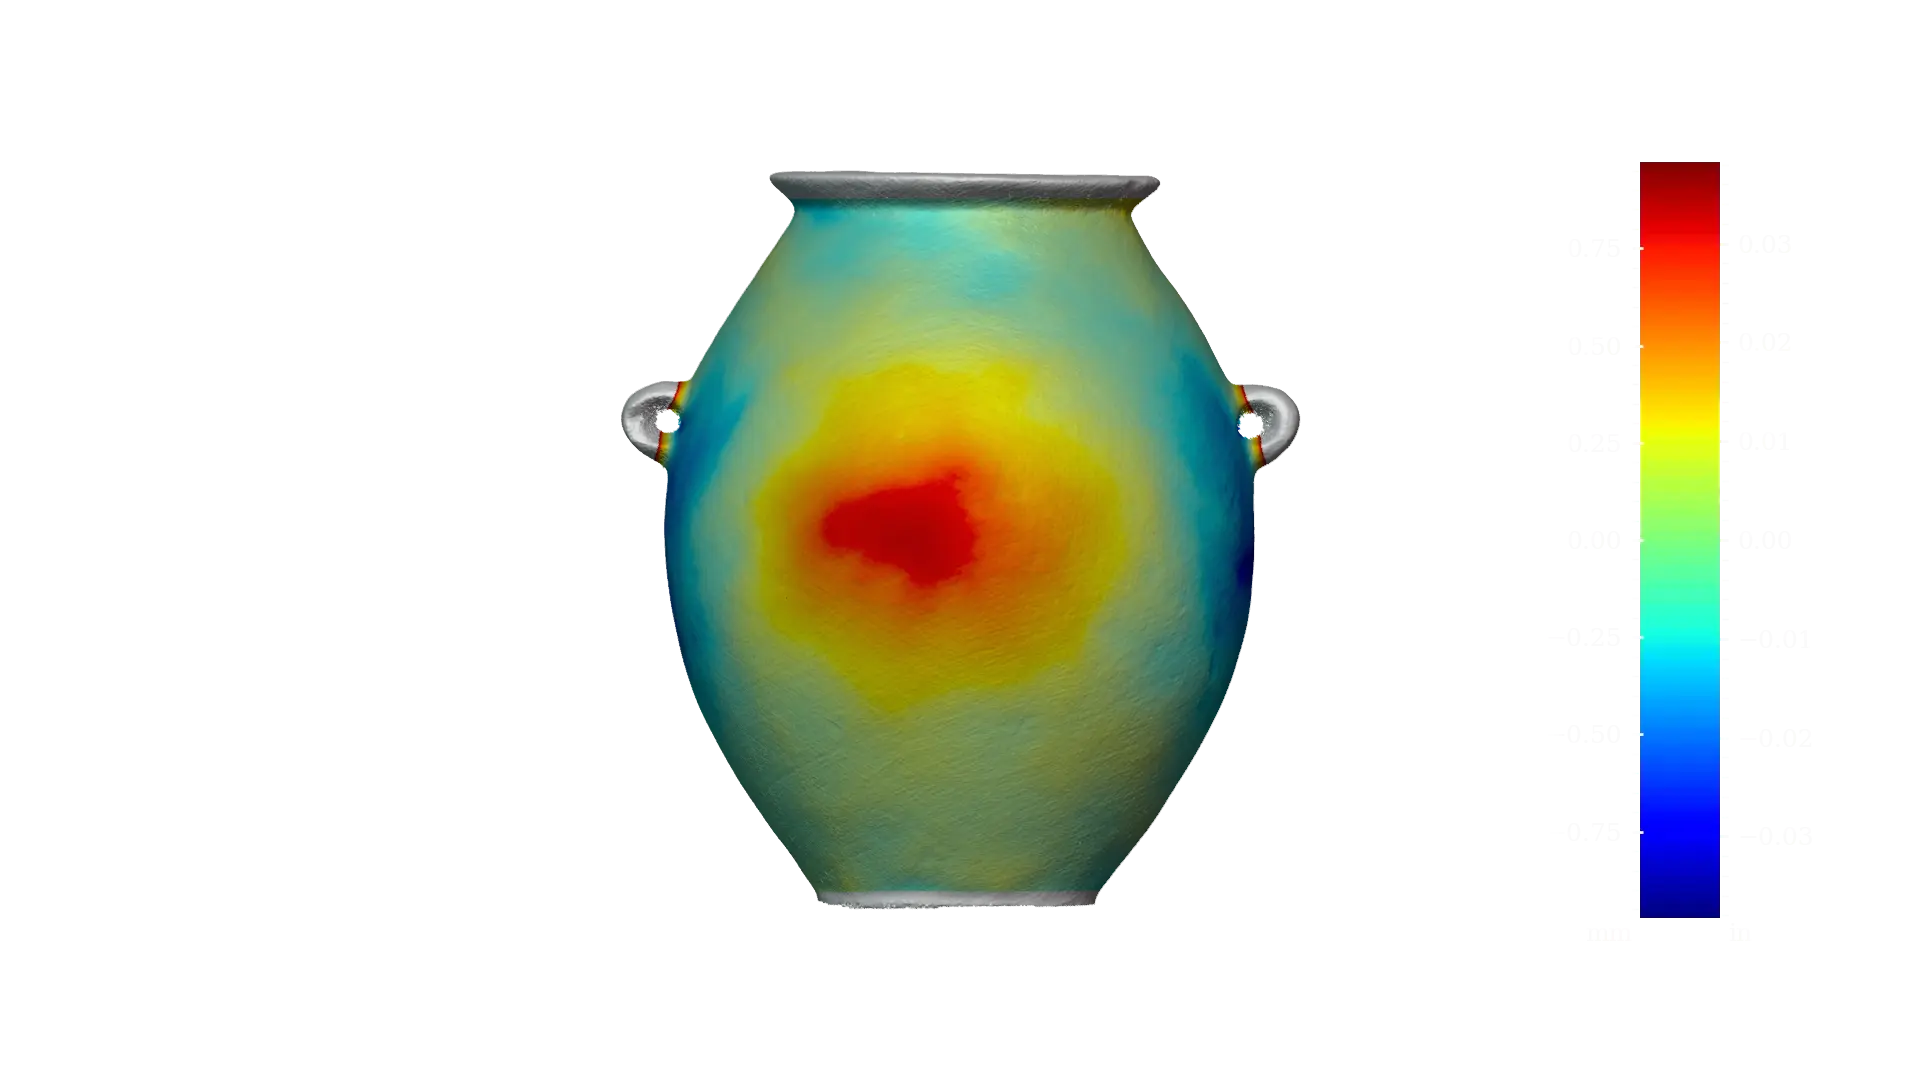
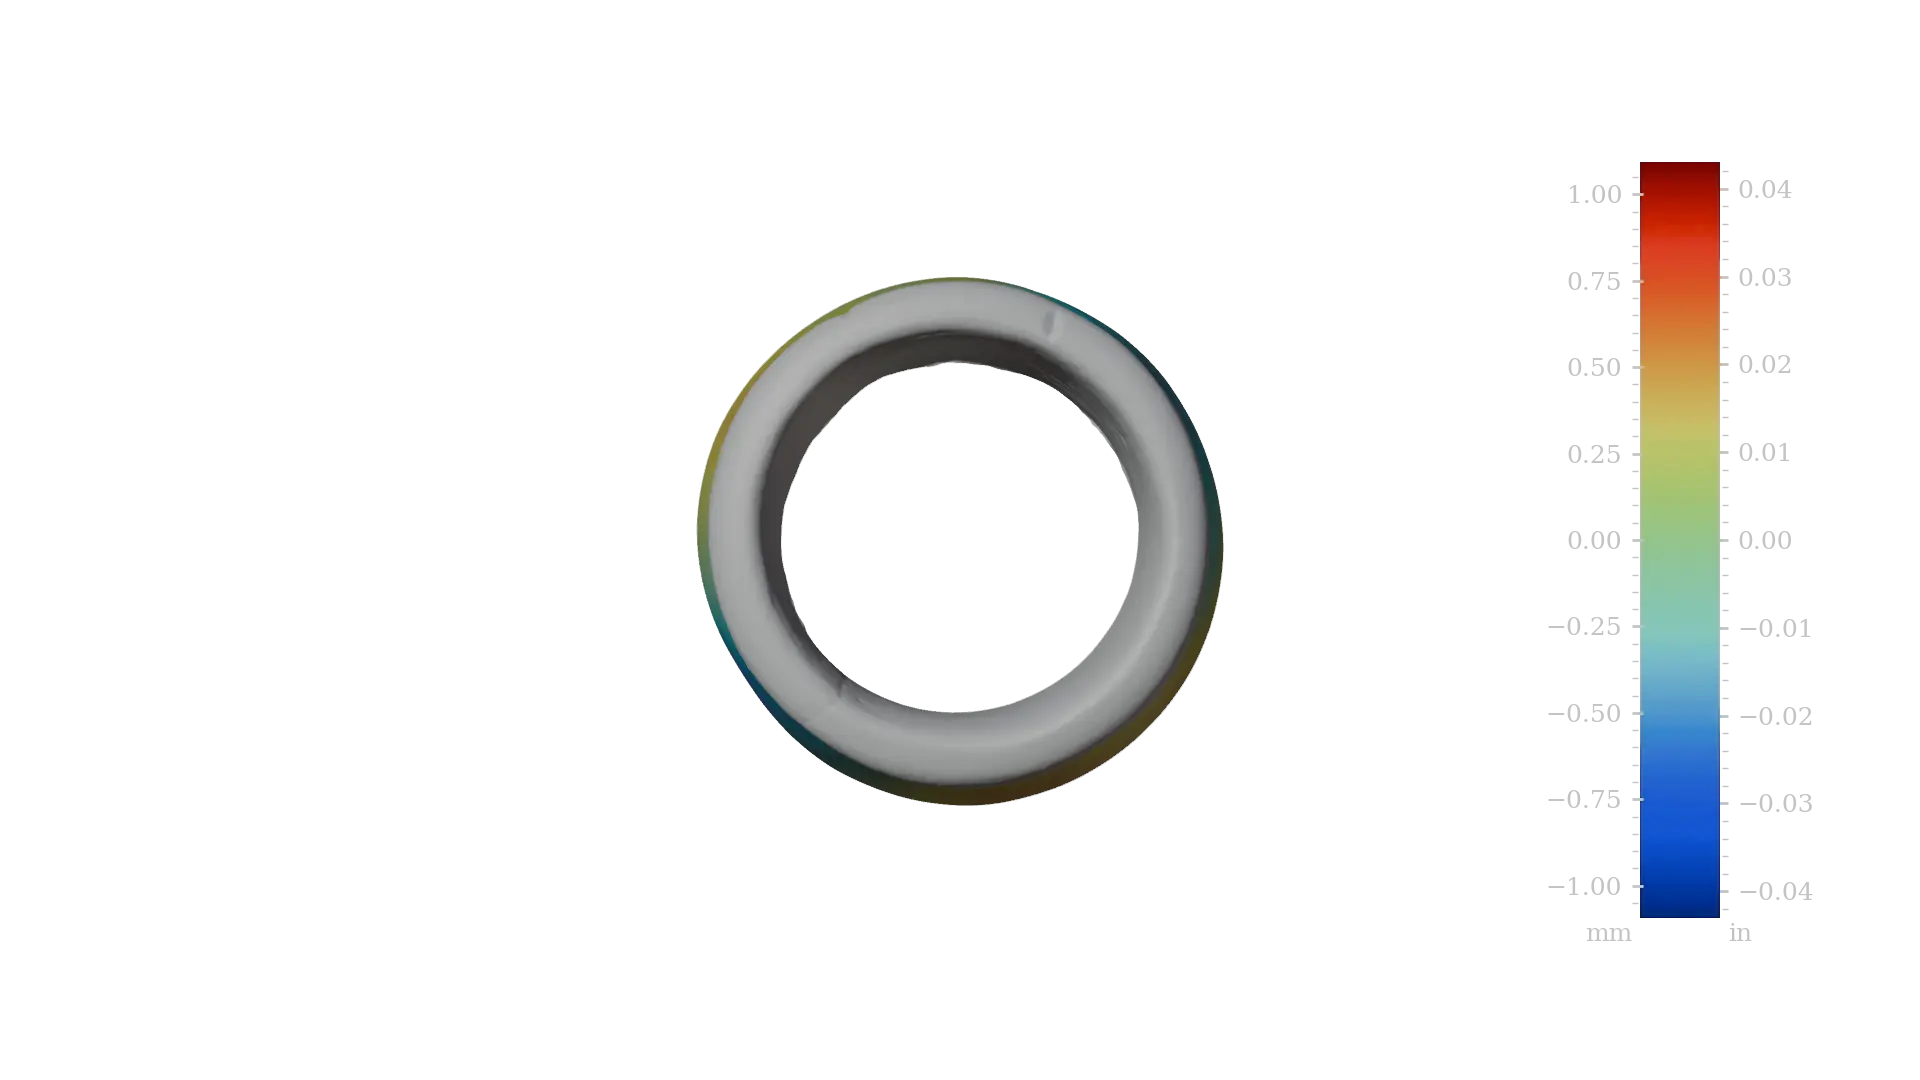
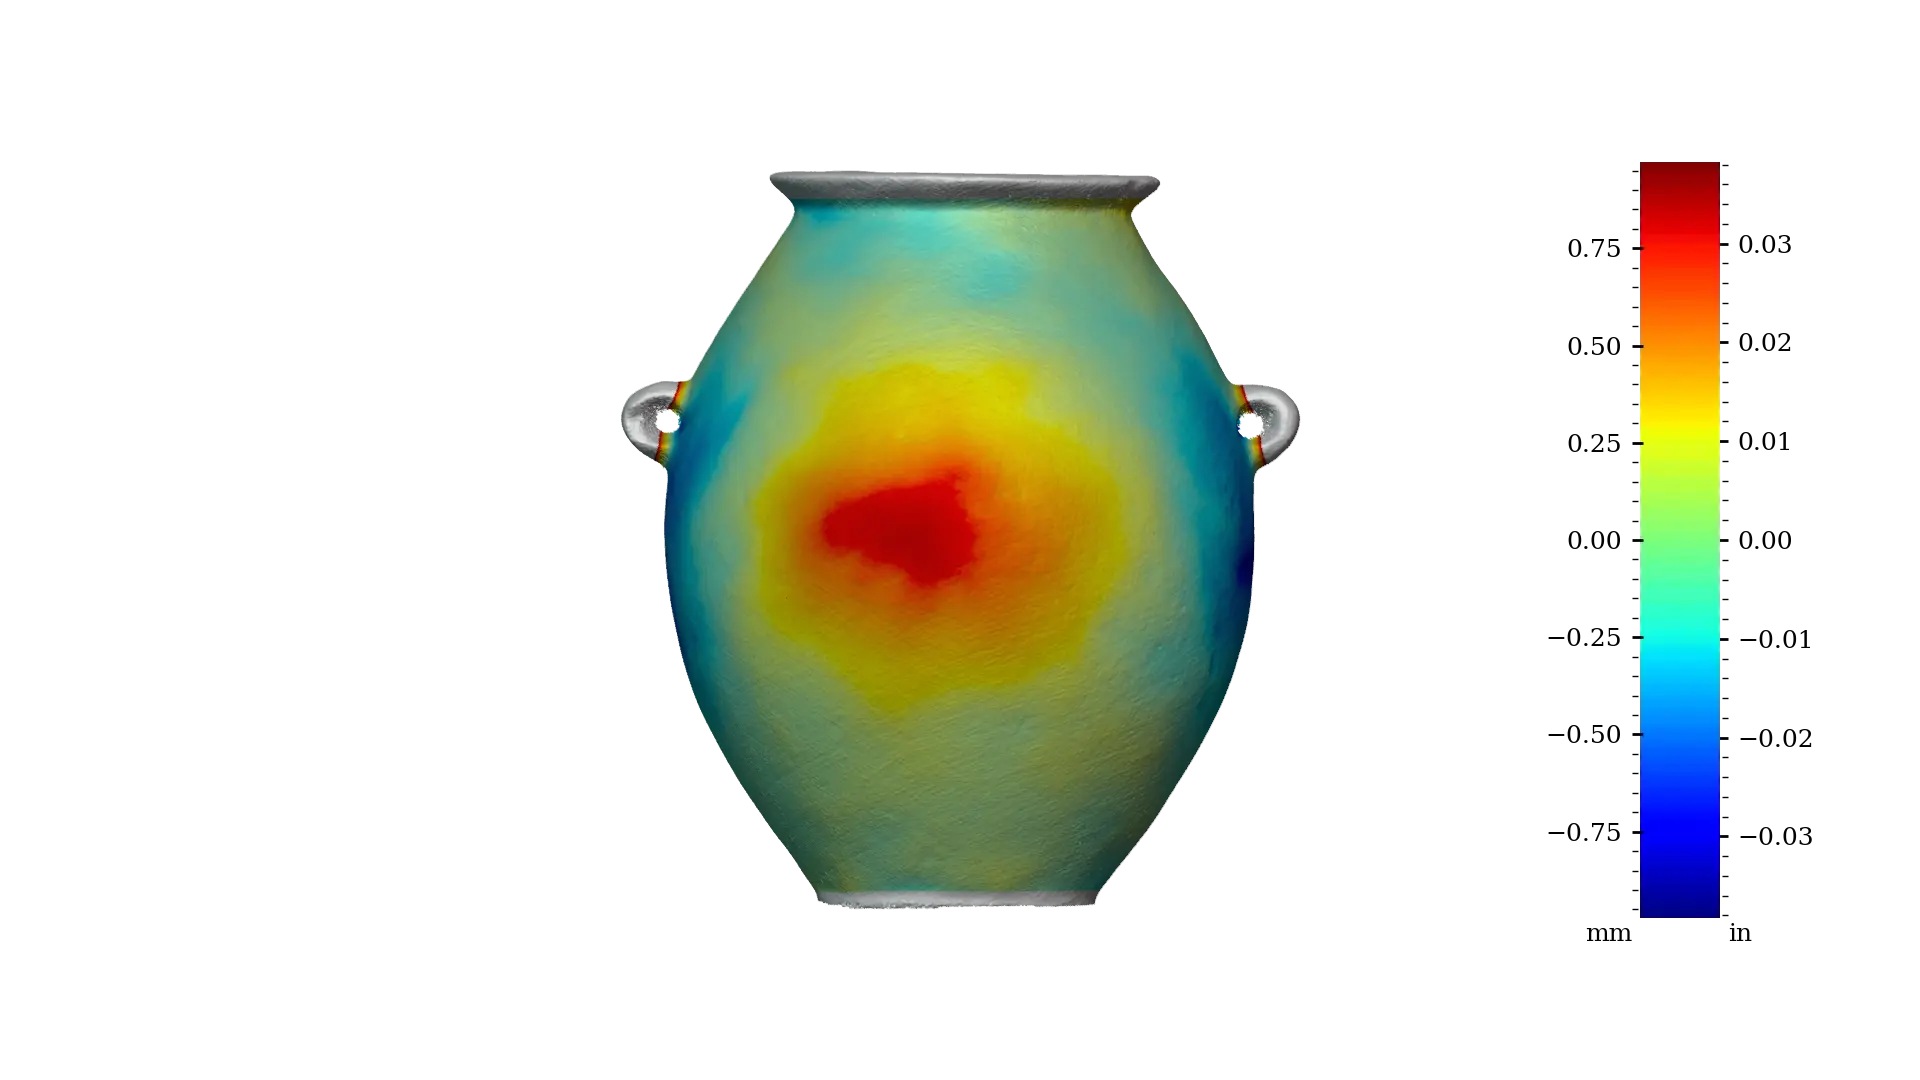 Figure 18 - MV020 exterior full
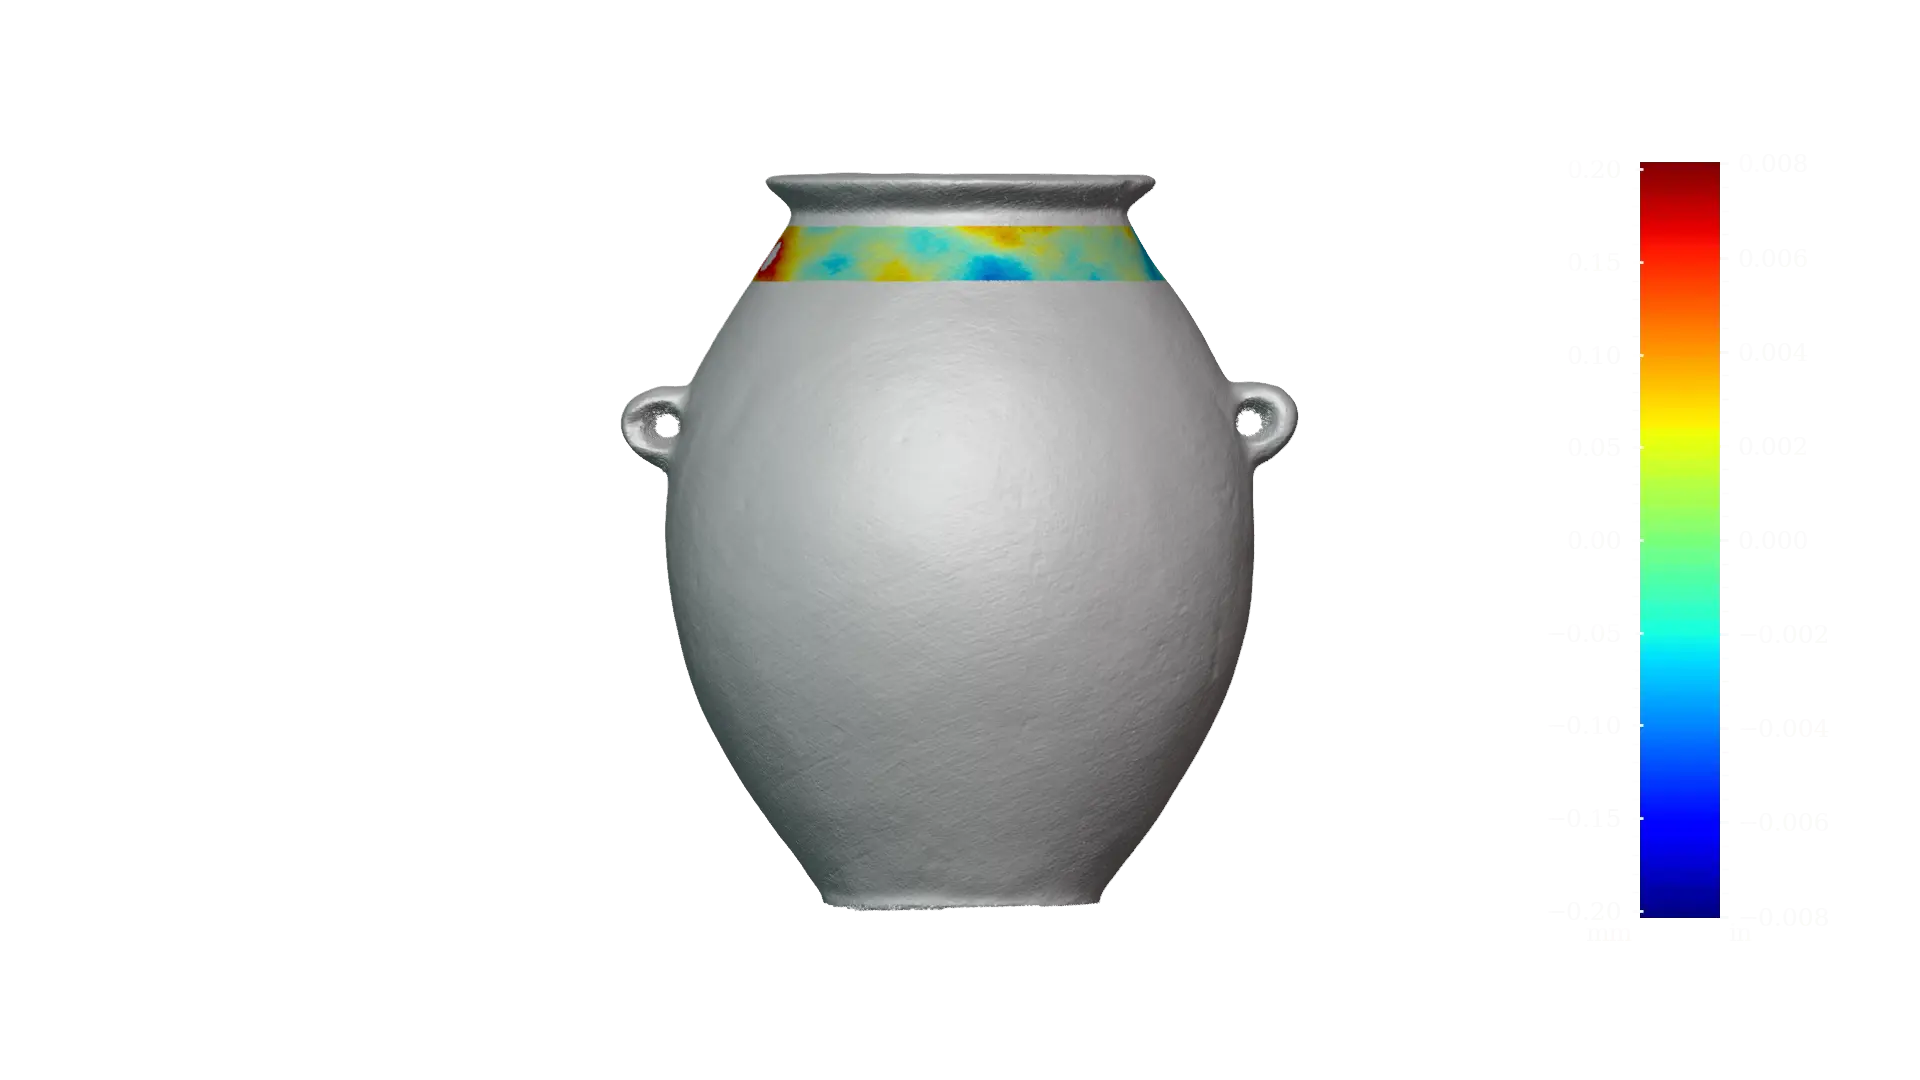
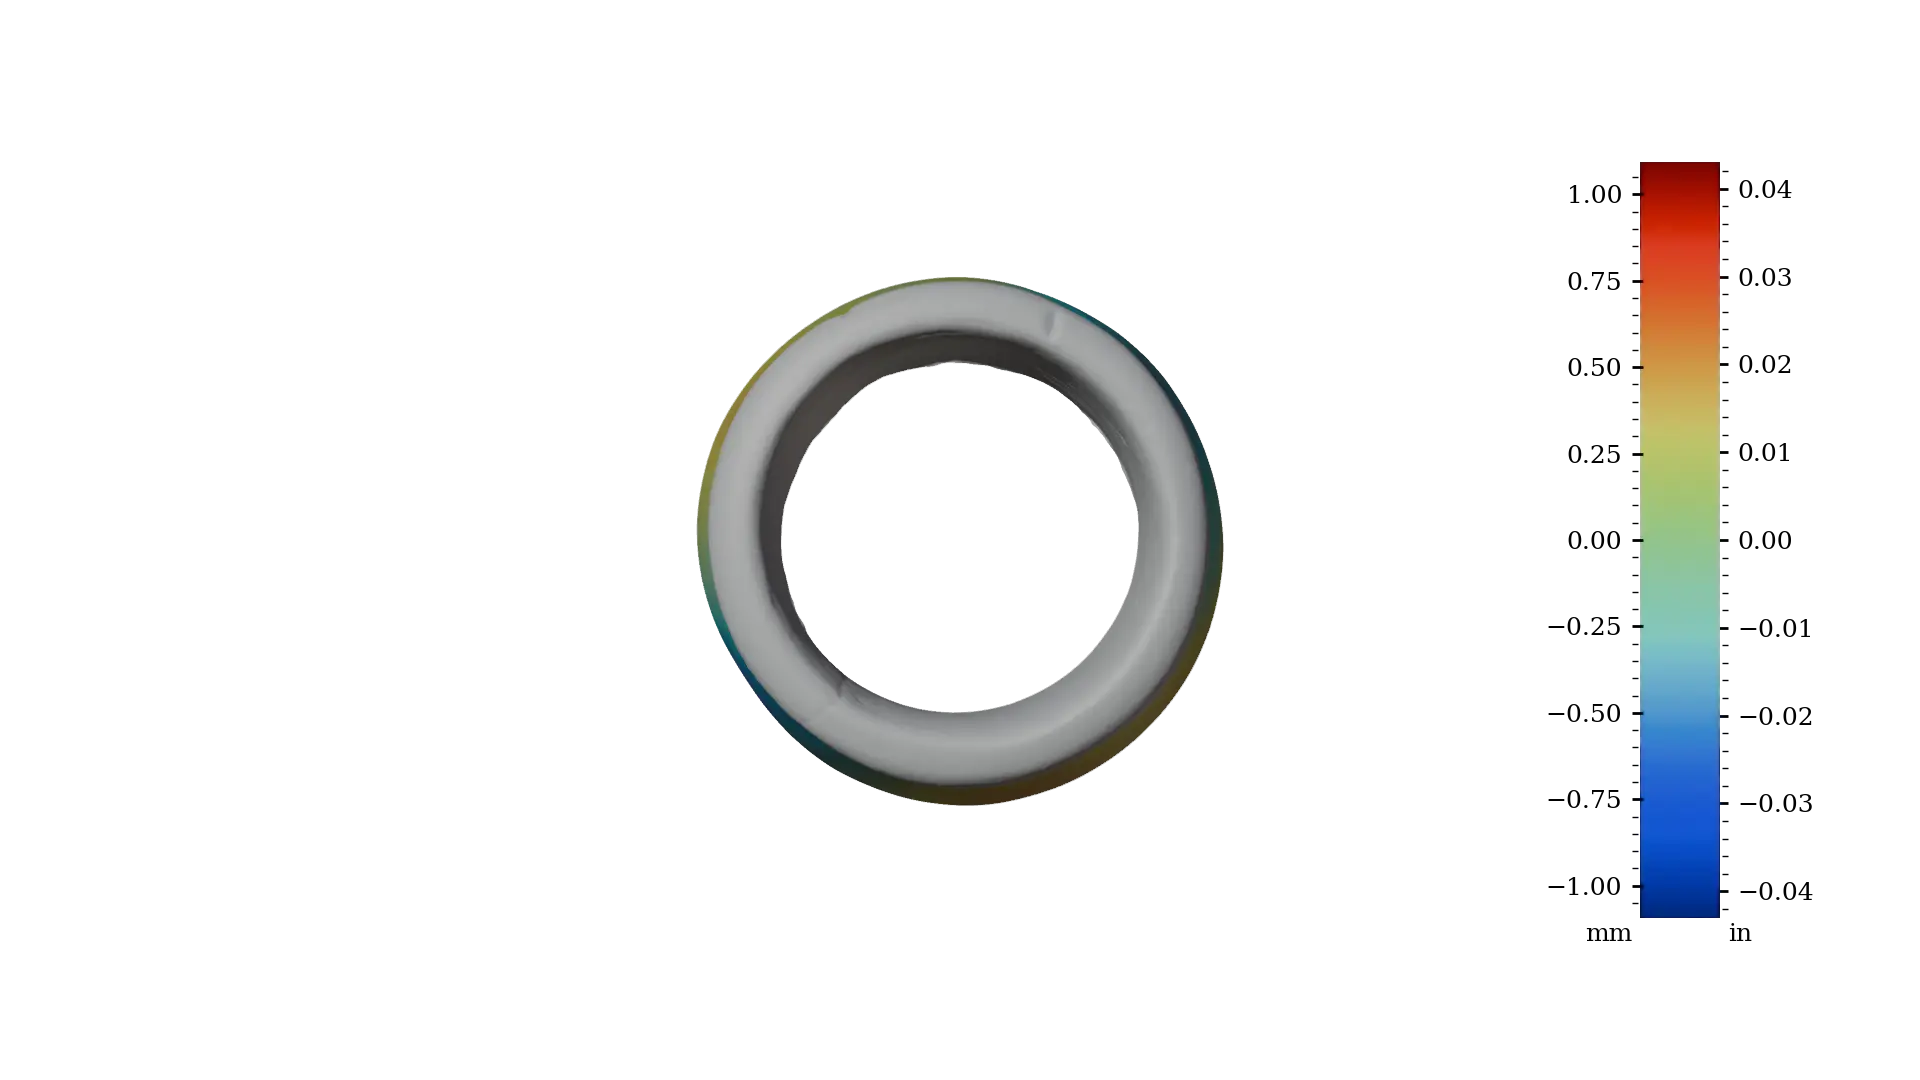
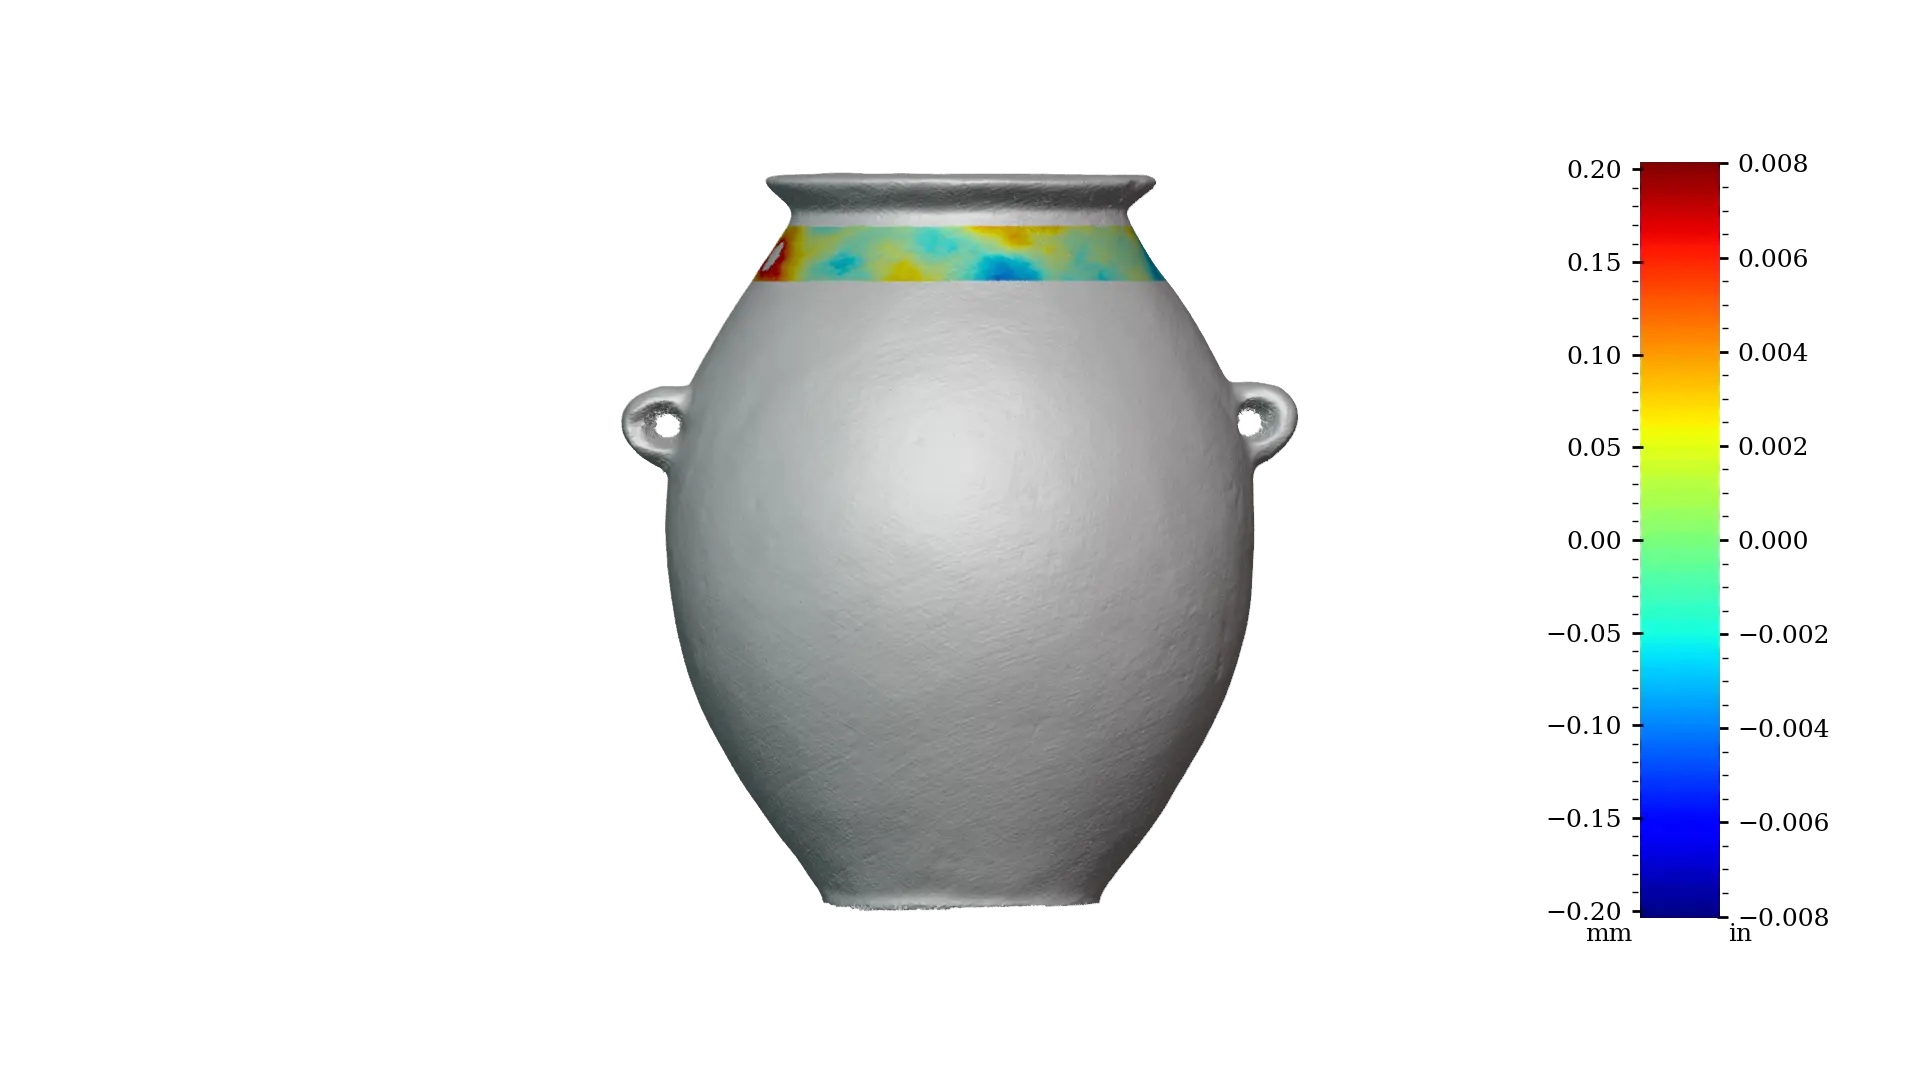 Figure 19 - MV020 exterior upper
The dramatic increase in precision score, from 9 (full) to 128 (upper only), highlights how regional form choices can suppress overall metrics when analyzed under a circular assumption.
Quantitative Comparison: Circular vs. Elliptical Fits
To determine whether the mid/lower zones are better described by an ellipse, we compare circular and elliptical best-fit models across three samples in the axial zones: upper, central, and lower.
For ellipticity, we perform a least-squares ellipse fit centered at the local z-axis fitting the variables for the semi-major and semi-minor axes (a,b), and crucially, a global rotational alignment determined prior to fitting.
The vessel’s orientation about the z-axis was first optimized by analyzing multiple horizontal cross-sections across the midbody and computing their individual best-fit ellipses. The dominant orientation of these ellipses was then used to rotate the entire 3D model such that the principal axis of ellipticity aligns with the x-axis (i.e., global θ=0∘). This pre-alignment ensures consistency and maximizes coherence across slices.
With the artifact thus normalized, the final ellipse fit is performed with rotation angle fixed at θ=0, allowing direct comparison between circular and elliptical models in a shared coordinate frame. This approach eliminates arbitrary orientation effects and enables a true metrological comparison: any improvement in fit quality under the elliptical model must result from shape fidelity, not rotational optimization.
Residual Analysis Confirms Superior Elliptical Fit
Figures 20–25 show residual plots (deviations from fit) for circular and elliptical models across the three zones.
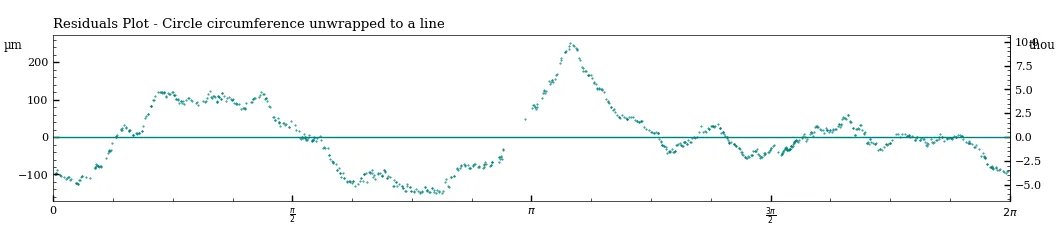 Figure 20: Residuals plot of a circularity sample at the upper part of the artifact MV020
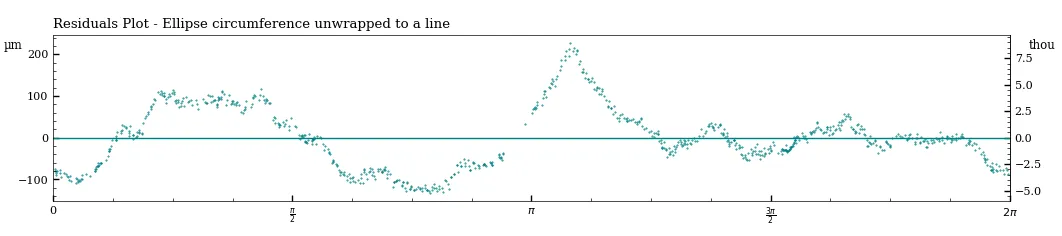 Figure 21: Residuals plot of a ellipticity sample at the upper part of the artifact MV020
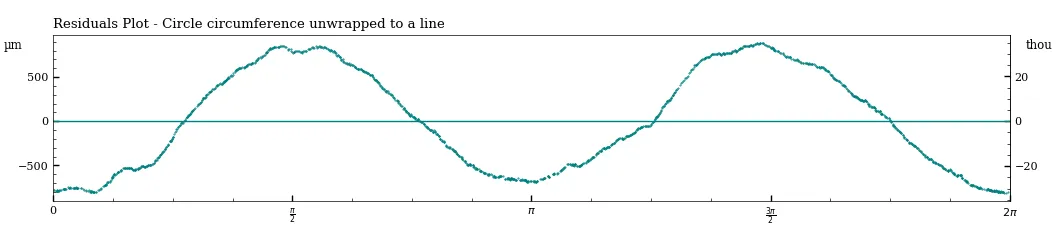 Figure 22: Residuals plot of a circularity sample at the central part of the artifact MV020
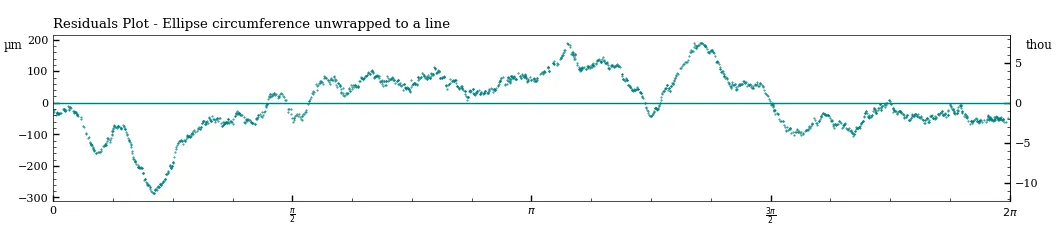 Figure 23: Residuals plot of a ellipticity sample at the central part of the artifact MV020
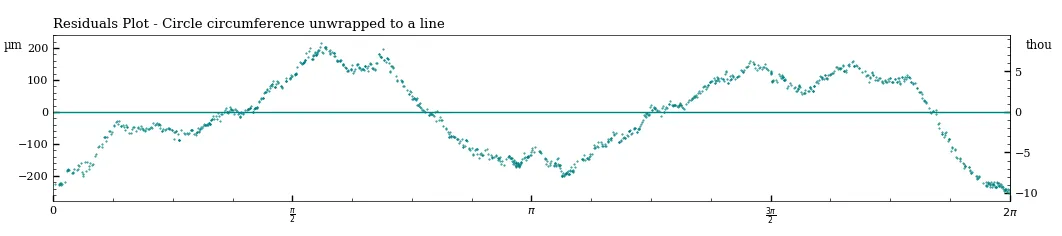 Figure 24: Residuals plot of a circularity sample at the lower part of the artifact MV020
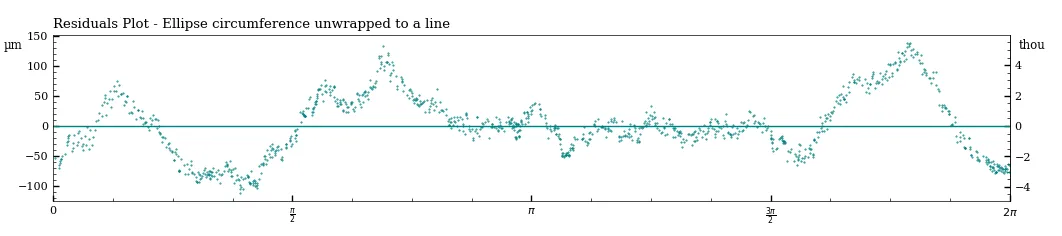 Figure 25: Residuals plot of a ellipticity sample at the lower part of the artifact MV020
To further validate this, we realigned the upper and lower halves of MV020 independently to correct for repositioning misalignment (a known axial discontinuity). We then computed circular and elliptical metrics across horizontal slices.
In Figure 26 and 27 we explore the circularity vs. ellipticity more rigorously. The upper and lower half of the artifact MV020 is aligned separately to remove the error caused by repositional misalignment. Figure 20 shows circularity metrics across horizontal slices of the artifact, Figure 21 shows ellipticity metrics across the same slices. It is clear again that the statistics are not note-worthily improved in the upper part of the artifact, however applying elliptic fitting accross the cross-sections, significantly improves the stats. Elliptical fits reduce RMSD significantly in the midsection and lower section compared to circular fits, even after this rigorous alignment, confirming that the observed form is not a distorted circle, but a coherent, intentionally aligned elliptical profile.
To further evaluate the geometric nature of the form, we performed a rigorous comparative analysis of circular and elliptical fits across horizontal cross-sections of MV020 (Figures 26–27). The upper and lower halves of the vessel were independently realigned along their local rotational axes to eliminate deviations caused by repositioning misalignment—a known source of axial discontinuity during fabrication.
Figure 26 displays the circularity metrics (RMSD, Range, SD) computed using best-fit circles at each slice. In the upper section, deviations remain low, consistent with true circularity. However, in the mid and lower regions, circular fitting yields significantly higher residuals.
In contrast, Figure 27 shows the same slices analyzed using best-fit ellipses, aligned to a common principal axis. This substantial improvement is not due to noise reduction or alignment correction, but reflects a fundamental match between the elliptical model and the actual geometry. The lack of significant improvement in the upper zone under elliptical fitting further confirms that this region is genuinely circular. Conversely, the marked reduction in deviation across the mid and lower body demonstrates that these zones are intrinsically elliptical in design, not merely distorted circles.
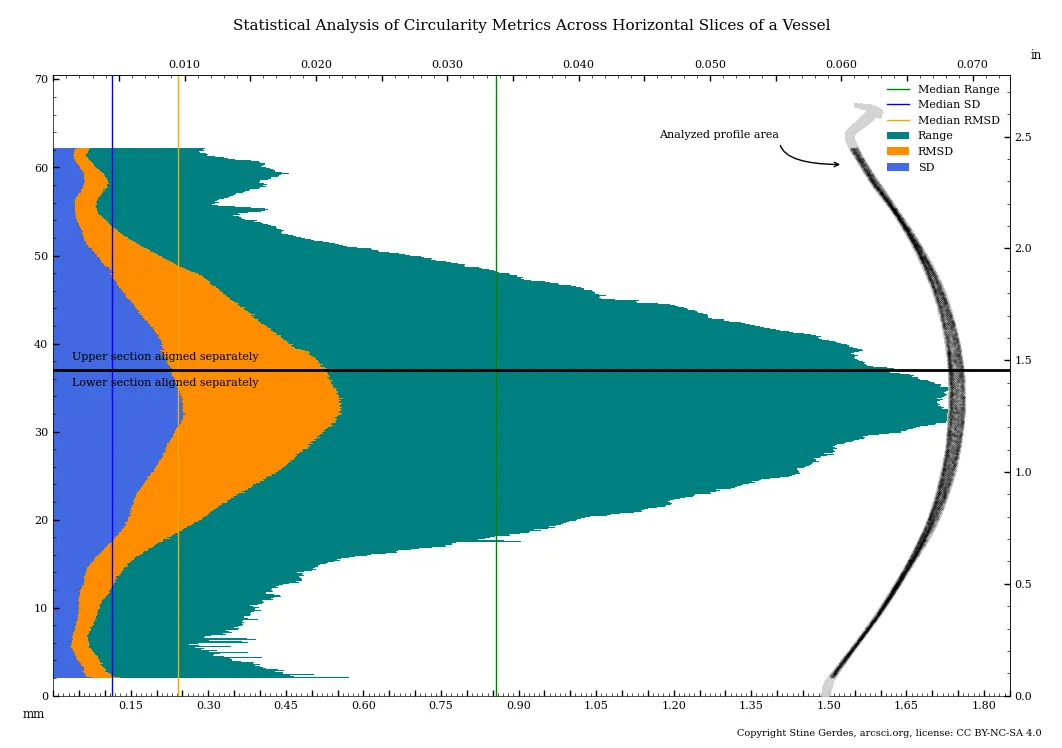 Figure 26: Circular metric across horizontal slices
Median Range: 856 μm | 33.7 thou
Median RMSD: 241 μm | 9.5 thou
Median SD: 113 μm | 4.4 thou
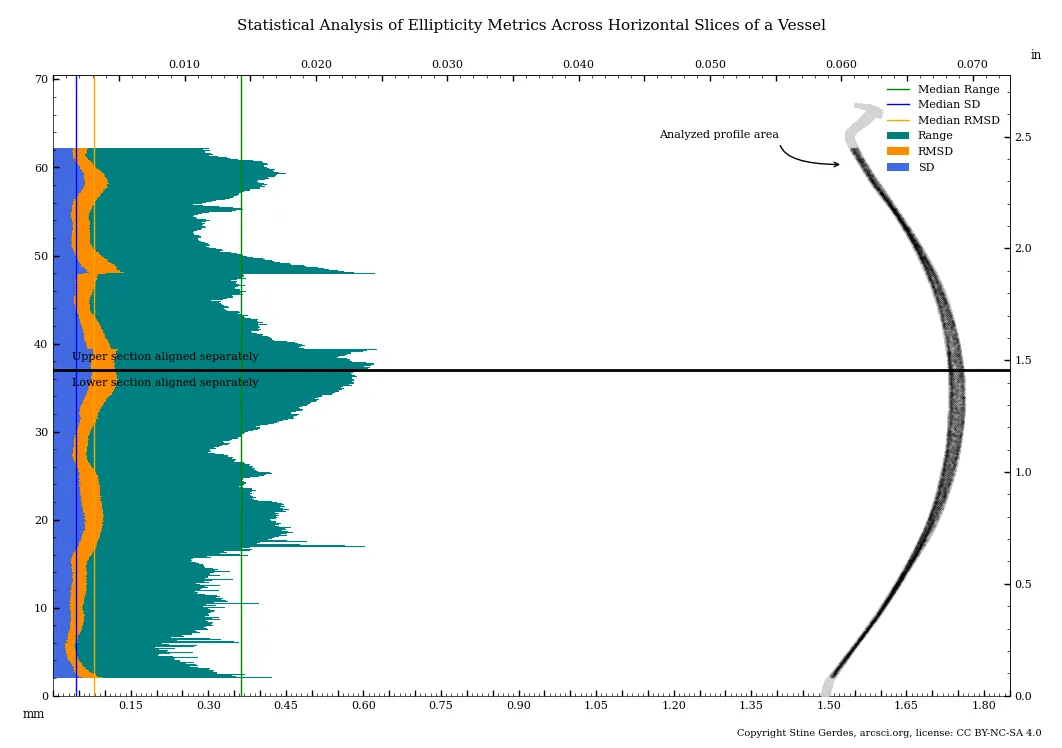 Figure 27: Ellipse metric across horizontal slices
Median Range: 362 μm | 14.3 thou
Median RMSD: 79 μm | 3.1 thou
Median SD: 44 μm | 1.7 thou
That such precise, coherent elliptical forms could be achieved using hand-powered tools, abrasives, and manual rotation, preserved over five millennia, remains a remarkable testament to the skill, planning, and technical mastery of Predynastic craftsmen.
Future work will directly compare circular and elliptical fitting strategies across the full dataset, quantify the degree of ellipticity, and explore whether this feature correlates with specific toolmarks or production stages.